MATELAN Research - ISRA VISION AG
MATELAN Research - ISRA VISION AG
MATELAN Research - ISRA VISION AG

You also want an ePaper? Increase the reach of your titles
YUMPU automatically turns print PDFs into web optimized ePapers that Google loves.
<strong>ISRA</strong> <strong>VISION</strong> In-Depth Report<br />
Double-digit sales and<br />
earnings growth<br />
continues in Q3<br />
Industrial automation<br />
driven by demand from<br />
automotive industry<br />
- 33 -<br />
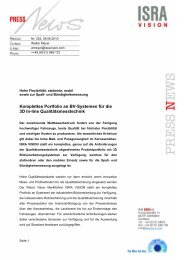
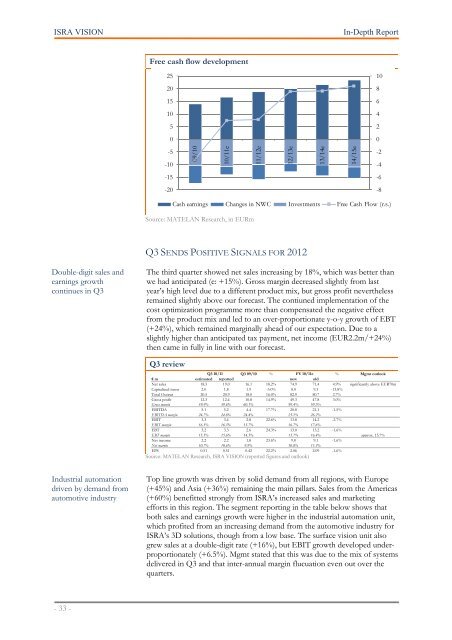
Free cash flow development<br />
25<br />
20<br />
15<br />
10<br />
5<br />
0<br />
-5<br />
-10<br />
-15<br />
-20<br />
Source: <strong>MATELAN</strong> <strong>Research</strong>, in EURm<br />
Q3 SENDS POSITIVE SIGNALS FOR 2012<br />
The third quarter showed net sales increasing by 18%, which was better than<br />
we had anticipated (e: +15%). Gross margin decreased slightly from last<br />
year’s high level due to a different product mix, but gross profit nevertheless<br />
remained slightly above our forecast. The contiuned implementation of the<br />
cost optimization programme more than compensated the negative effect<br />
from the product mix and led to an over-proportionate y-o-y growth of EBT<br />
(+24%), which remained marginally ahead of our expectation. Due to a<br />
slightly higher than anticipated tax payment, net income (EUR2.2m/+24%)<br />
then came in fully in line with our forecast.<br />
Q3 review<br />
09/10<br />
10/11e<br />
11/12e<br />
Cash earnings Changes in NWC Investments Free Cash Flow (r.s.)<br />
Q3 10/11 Q3 09/10 % FY 10/11e<br />
% Mgmt outlook<br />
€ m estimated reported new old<br />
Net sales 18.5 19.0 16.1 18.2% 74.9 71.4 4.9% significantly above EUR70m<br />
Capitalized items 2.0 1.8 1.9 -3.0% 8.0 9.3 -13.8%<br />
Total Output 20.5 20.9 18.0 16.0% 82.9 80.7 2.7%<br />
Gross profit 12.3 12.4 10.8 14.9% 49.3 47.8 3.0%<br />
Gross margin 59.9% 59.6% 60.1% 59.4% 59.3%<br />
EBITDA 5.1 5.2 4.4 17.7% 20.8 21.1 -1.5%<br />
EBITDA margin 24.7% 24.8% 24.4% 25.1% 26.2%<br />
EBIT 3.3 3.4 2.8 22.6% 13.8 14.2 -2.7%<br />
EBIT margin 16.3% 16.5% 15.7% 16.7% 17.6%<br />
EBT 3.2 3.3 2.6 24.3% 13.0 13.2 -1.6%<br />
EBT margin 15.5% 15.6% 14.5% 15.7% 16.4% approx. 15.7%<br />
Net income 2.2 2.2 1.8 23.6% 9.0 9.1 -1.6%<br />
Net margin 10.7% 10.6% 9.9% 10.8% 11.3%<br />
EPS 0.51 0.51 0.42 22.2% 2.06 2.09 -1.6%<br />
Source: <strong>MATELAN</strong> <strong>Research</strong>, <strong>ISRA</strong> <strong>VISION</strong> (reported figures and outlook)<br />
Top line growth was driven by solid demand from all regions, with Europe<br />
(+45%) and Asia (+36%) remaining the main pillars. Sales from the Americas<br />
(+60%) benefitted strongly from <strong>ISRA</strong>’s increased sales and marketing<br />
efforts in this region. The segment reporting in the table below shows that<br />
both sales and earnings growth were higher in the industrial automation unit,<br />
which profited from an increasing demand from the automotive industry for<br />
<strong>ISRA</strong>’s 3D solutions, though from a low base. The surface vision unit also<br />
grew sales at a double-digit rate (+16%), but EBIT growth developed underproportionately<br />
(+6.5%). Mgmt stated that this was due to the mix of systems<br />
delivered in Q3 and that inter-annual margin flucuation even out over the<br />
quarters.<br />
12/13e<br />
13/14e<br />
14/15e<br />
10<br />
8<br />
6<br />
4<br />
2<br />
0<br />
-2<br />
-4<br />
-6<br />
-8