MATELAN Research - ISRA VISION AG
MATELAN Research - ISRA VISION AG
MATELAN Research - ISRA VISION AG

You also want an ePaper? Increase the reach of your titles
YUMPU automatically turns print PDFs into web optimized ePapers that Google loves.
<strong>ISRA</strong> <strong>VISION</strong> In-Depth Report<br />
Low capital intensity<br />
High net working capital<br />
needs<br />
Driving NWC further<br />
down could unlock<br />
additional value<br />
- 31 -<br />
WORKING CAPITAL IS THE MAIN BALANCE SHEET LEVER<br />
The anticipated balance sheet development is geared in essence to past ratios.<br />
Tangible assets only grow moderately as <strong>ISRA</strong>, being a software company,<br />
needs little equipment to pursue the business. The growth of intangible assets<br />
is linked to capitalized development, which usually accounts for 12% of net<br />
sales and grows accordingly (ex depreciation).<br />
Working capital has been a critical issue for <strong>ISRA</strong> for quite some time. The<br />
following table shows that at the end of the financial year 2009/10 <strong>ISRA</strong> had<br />
83% of the sales achieved in this year bound in working capital. This is<br />
materially higher than all of the competitors listed here. We find that while<br />
payable days outstanding even look very favourable and inventory turnover is<br />
still acceptable, it is in particular outstanding receivables that is spoiling the<br />
picture.<br />
Comparison of net working capital<br />
<strong>ISRA</strong> AVT Basler Viscom Cognex Perceptron Elexis Orbotech<br />
Sales 64.8 39.7 51.0 40.0 290.7 52.1 136.7 529.4<br />
Inventories 14.1 5.9 7.4 10.2 22.7 6.6 23.1 112.8<br />
Inventory turnover 79.5 54.5 53.2 92.7 28.5 45.9 61.7 77.8<br />
Trade Receivables 46.9 5.7 7.0 12.2 45.9 16.7 22.7 153.5<br />
Days outstanding 263.8 52.4 49.8 110.8 57.6 117.2 60.7 105.9<br />
Trade Payables 7.1 1.4 1.3 1.7 7.2 3.7 11.6 26.5<br />
Days outstanding 39.7 12.7 9.4 15.3 9.0 26.2 30.9 18.3<br />
Net Working Capital 53.9 10.2 13.1 20.6 61.5 19.5 34.3 239.8<br />
% of sales 83.2% 25.8% 25.7% 51.6% 21.1% 37.5% 25.1% 45.3%<br />
Source: Company reports of last financial year, in local currency (m)<br />
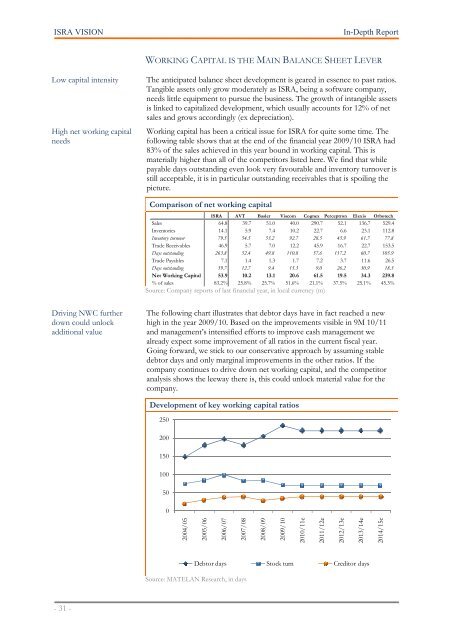
The following chart illustrates that debtor days have in fact reached a new<br />
high in the year 2009/10. Based on the improvements visible in 9M 10/11<br />
and management’s intensified efforts to improve cash management we<br />
already expect some improvement of all ratios in the current fiscal year.<br />
Going forward, we stick to our conservative approach by assuming stable<br />
debtor days and only marginal improvements in the other ratios. If the<br />
company continues to drive down net working capital, and the competitor<br />
analysis shows the leeway there is, this could unlock material value for the<br />
company.<br />
Development of key working capital ratios<br />
250<br />
200<br />
150<br />
100<br />
50<br />
0<br />
2004/05<br />
2005/06<br />
2006/07<br />
2007/08<br />
Source: <strong>MATELAN</strong> <strong>Research</strong>, in days<br />
2008/09<br />
2009/10<br />
2010/11e<br />
2011/12e<br />
2012/13e<br />
2013/14e<br />
Debtor days Stock turn Creditor days<br />
2014/15e