MATELAN Research - ISRA VISION AG
MATELAN Research - ISRA VISION AG
MATELAN Research - ISRA VISION AG

Create successful ePaper yourself
Turn your PDF publications into a flip-book with our unique Google optimized e-Paper software.
<strong>ISRA</strong> <strong>VISION</strong> In-Depth Report<br />
FINANCIAL ANALYSIS<br />
Conservative growth …<br />
… and margin<br />
assumptions<br />
- 29 -<br />
DRAWING A CONSERVATIVE GROWTH SCENARIO<br />
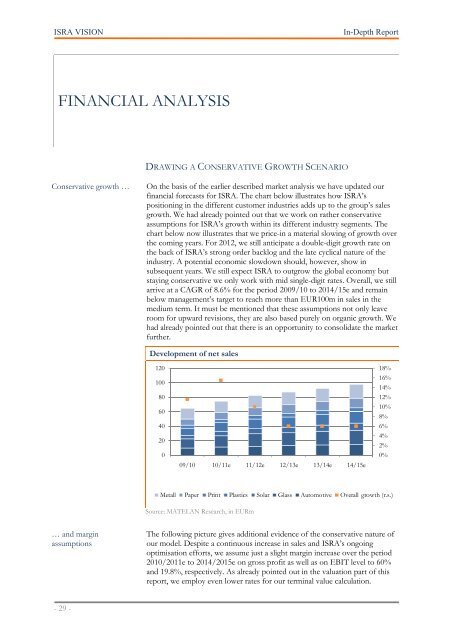
On the basis of the earlier described market analysis we have updated our<br />
financial forecasts for <strong>ISRA</strong>. The chart below illustrates how <strong>ISRA</strong>’s<br />
positioning in the different customer industries adds up to the group’s sales<br />
growth. We had already pointed out that we work on rather conservative<br />
assumptions for <strong>ISRA</strong>’s growth within its different industry segments. The<br />
chart below now illustrates that we price-in a material slowing of growth over<br />
the coming years. For 2012, we still anticipate a double-digit growth rate on<br />
the back of <strong>ISRA</strong>’s strong order backlog and the late cyclical nature of the<br />
industry. A potential economic slowdown should, however, show in<br />
subsequent years. We still expect <strong>ISRA</strong> to outgrow the global economy but<br />
staying conservative we only work with mid single-digit rates. Overall, we still<br />
arrive at a C<strong>AG</strong>R of 8.6% for the period 2009/10 to 2014/15e and remain<br />
below management’s target to reach more than EUR100m in sales in the<br />
medium term. It must be mentioned that these assumptions not only leave<br />
room for upward revisions, they are also based purely on organic growth. We<br />
had already pointed out that there is an opportunity to consolidate the market<br />
further.<br />
Development of net sales<br />
120<br />
100<br />
80<br />
60<br />
40<br />
20<br />
0<br />
09/10 10/11e 11/12e 12/13e 13/14e 14/15e<br />
Source: <strong>MATELAN</strong> <strong>Research</strong>, in EURm<br />
18%<br />
16%<br />
14%<br />
12%<br />
10%<br />
8%<br />
6%<br />
4%<br />
2%<br />
0%<br />
Metall Paper Print Plastics Solar Glass Automotive Overall growth (r.s.)<br />
The following picture gives additional evidence of the conservative nature of<br />
our model. Despite a continuous increase in sales and <strong>ISRA</strong>’s ongoing<br />
optimisation efforts, we assume just a slight margin increase over the period<br />
2010/2011e to 2014/2015e on gross profit as well as on EBIT level to 60%<br />
and 19.8%, respectively. As already pointed out in the valuation part of this<br />
report, we employ even lower rates for our terminal value calculation.