

Northeast San Fernando Valley
NEV%20Strategy%20Publication%20Draft%20Revision%20I
NEV%20Strategy%20Publication%20Draft%20Revision%20I

Create successful ePaper yourself
Turn your PDF publications into a flip-book with our unique Google optimized e-Paper software.
<strong>Northeast</strong> <strong>San</strong> <strong>Fernando</strong> <strong>Valley</strong> Sustainability and Prosperity<br />
Strategy Full Report<br />
and Updates:<br />
www.<strong>Northeast</strong>Strategy.org<br />
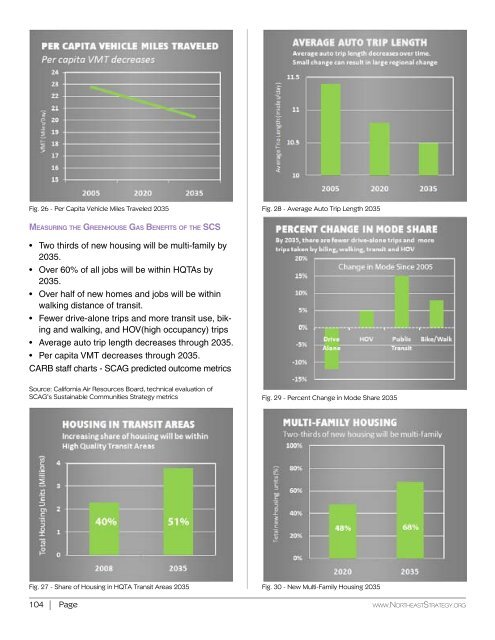
Fig. 26 - Per Capita Vehicle Miles Traveled 2035 Fig. 28 - Average Auto Trip Length 2035<br />
Measuring the Greenhouse Gas Benefits of the SCS<br />
• Two thirds of new housing will be multi-family by<br />
2035.<br />
• Over 60% of all jobs will be within HQTAs by<br />
2035.<br />
• Over half of new homes and jobs will be within<br />
walking distance of transit.<br />
• Fewer drive-alone trips and more transit use, biking<br />
and walking, and HOV(high occupancy) trips<br />
• Average auto trip length decreases through 2035.<br />
• Per capita VMT decreases through 2035.<br />
CARB staff charts - SCAG predicted outcome metrics<br />
SCAG.CA.GOV<br />
Source: California Air Resources Board, technical evaluation of<br />
SCAG’s Sustainable Communities Strategy metrics<br />
Fig. 29 - Percent Change in Mode Share 2035<br />
MULHOLLAND<br />
INSTITUTE<br />
MULHOLLAND INSTITUTE<br />
23679 Calabasas Road #507 • Calabasas, CA 91302<br />
Fig. 27 - Share of Housing in HQTA Transit Areas 2035 Fig. 30 - New Multi-Family Housing 2035<br />
818.712.9500 • f. 818.666.7487<br />
104 Page www.<strong>Northeast</strong>Strategy.org<br />
Draft Revision I - May 25, 2016<br />
Page 105