

Northeast San Fernando Valley
NEV%20Strategy%20Publication%20Draft%20Revision%20I
NEV%20Strategy%20Publication%20Draft%20Revision%20I

Create successful ePaper yourself
Turn your PDF publications into a flip-book with our unique Google optimized e-Paper software.
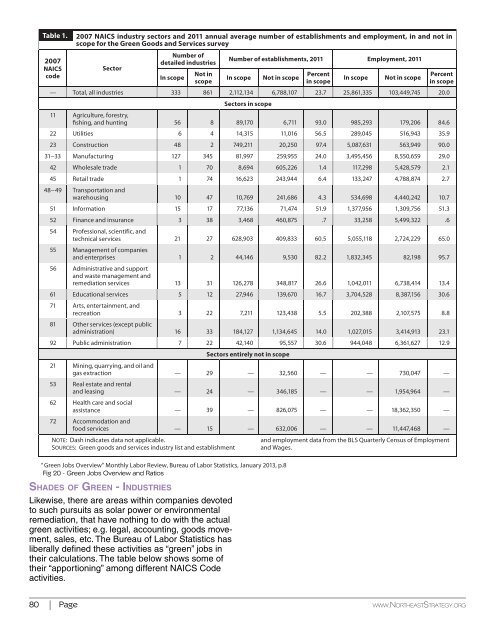
Table 1. 2007 NAICS industry sectors and 2011 annual average number of establishments and employment, in and not in<br />
scope for the Green Goods and Services survey<br />
2007<br />
NAICS<br />
code<br />
Sector<br />
Number of<br />
detailed industries<br />
Number of establishments, 2011 Employment, 2011<br />
In scope<br />
Not in<br />
Percent<br />
Percent<br />
In scope Not in scope In scope Not in scope<br />
scope in scope in scope<br />
— Total, all industries 333 861 2,112,134 6,788,107 23.7 25,861,335 103,449,745 20.0<br />
Sectors in scope<br />
11 Agriculture, forestry,<br />
fishing, and hunting 56 8 89,170 6,711 93.0 985,293 179,206 84.6<br />
22 Utilities 6 4 14,315 11,016 56.5 289,045 516,943 35.9<br />
23 Construction 48 2 749,211 20,250 97.4 5,087,631 563,949 90.0<br />
31−33 Manufacturing 127 345 81,997 259,955 24.0 3,495,456 8,550,659 29.0<br />
42 Wholesale trade 1 70 8,694 605,226 1.4 117,298 5,428,579 2.1<br />
45 Retail trade 1 74 16,623 243,944 6.4 133,247 4,788,874 2.7<br />
48−49<br />
Transportation and<br />
warehousing 10 47 10,769 241,686 4.3 534,698 4,440,242 10.7<br />
51 Information 15 17 77,136 71,474 51.9 1,377,956 1,309,756 51.3<br />
52 Finance and insurance 3 38 3,468 460,875 .7 33,258 5,499,322 .6<br />
54 Professional, scientific, and<br />
technical services 21 27 628,903 409,833 60.5 5,055,118 2,724,229 65.0<br />
55 Management of companies<br />
and enterprises 1 2 44,146 9,530 82.2 1,832,345 82,198 95.7<br />
56 Administrative and support<br />
and waste management and<br />
remediation services 13 31 126,278 348,817 26.6 1,042,011 6,738,414 13.4<br />
61 Educational services 5 12 27,946 139,670 16.7 3,704,528 8,387,156 30.6<br />
71 Arts, entertainment, and<br />
recreation 3 22 7,211 123,438 5.5 202,388 2,107,575 8.8<br />
81 Other services (except public<br />
administration) 16 33 184,127 1,134,645 14.0 1,027,015 3,414,913 23.1<br />
92 Public administration 7 22 42,140 95,557 30.6 944,048 6,361,627 12.9<br />
Sectors entirely not in scope<br />
21 Mining, quarrying, and oil and<br />
gas extraction — 29 — 32,560 — — 730,047 —<br />
53 Real estate and rental<br />
and leasing — 24 — 346,185 — — 1,954,964 —<br />
62 Health care and social<br />
assistance — 39 — 826,075 — — 18,362,350 —<br />
72 Accommodation and<br />
food services — 15 — 632,006 — — 11,447,468 —<br />
NOTE: Dash indicates data not applicable.<br />
SOURCES: Green goods and services industry list and establishment<br />
“ Green Jobs Overview” Monthly Labor Review, Bureau of Labor Statistics, January 2013, p.8<br />
Fig 20 - Green Jobs Overview and Ratios<br />
Shades of Green - Industries<br />
Likewise, there are areas within companies devoted<br />
to such pursuits as solar power or environmental<br />
remediation, that have nothing to do with the actual<br />
green activities; e.g. legal, accounting, goods movement,<br />
sales, etc. The Bureau of Labor Statistics has<br />
liberally defined these activities as “green” jobs in<br />
their calculations. The table below shows some of<br />
their “apportioning” among different NAICS Code<br />
activities.<br />
and employment data from the BLS Quarterly Census of Employment<br />
and Wages.<br />
Clean Economy by Industry (NAICS-Based) 5<br />
NAICS - Industry Title - 2010 Job Count - % Proportion of Clean Jobs<br />
11 Agriculture, Forestry, Fishing and Hunting 31,373 1.2<br />
21 Mining, Quarrying, and Oil and Gas Extraction 1,091 0.0<br />
22 Utilities 155,875 5.8 23 Construction 106,109 4.0<br />
31-33 Manufacturing 687,116 25.7<br />
42 Wholesale Trade 157,476 5.9<br />
44-45 Retail Trade 15,977 0.6<br />
48-49 Transportation and Warehousing 341,041 12.7<br />
51 Information 657 0.0<br />
52 Finance and Insurance 565 0.0<br />
53 Real Estate and Rental and Leasing 718 0.0<br />
54 Professional, Scientific, and Technical Services 278,621 10.4<br />
55 Management of Companies and Enterprises 453 0.0<br />
56 Admin/Support/Waste Management/Remediation 299,409 11.2<br />
61 Educational Services 520 0.0<br />
62 Health Care and Social Assistance 2,115 0.1<br />
71 Arts, Entertainment, and Recreation 253 0.0<br />
72 Accommodation and Food Services 314 0.0<br />
81 Other Services (except Public Administration) 21,067 0.8<br />
92 Public Administration 574,795 21.5<br />
The manufacturing sector contains the largest<br />
proportion of green jobs, and Los Angeles has the<br />
second highest concentration in the United States.<br />
It is fair to conclude that there are not too many<br />
places where green opportunities are better than<br />
Los Angeles.<br />
Discontinuation of Green Goods and Services Industry<br />
Employment Data<br />
On March 1, 2013, the President ordered into effect<br />
the across-the-board spending cuts. Under the order,<br />
the Bureau of Labor Statistics (BLS) was compelled<br />
to cut its budget by more than $30 million.<br />
In order to achieve these savings and protect core<br />
programs, the BLS eliminated several programs,<br />
including all “measuring green jobs” products.<br />
Deterrents to Innovation<br />
Los Angeles launched the nation’s largest Feed-in<br />
Tariff (FiT) In-Basin Solar program in 2013—wellimplemented<br />
FiT is that it will drive economic<br />
growth, enhance environmental sustainability and<br />
create social equity in the workforce—solar equity<br />
“hot spots,” areas with rooftops waiting for conversion<br />
in disadvantaged areas in need of career ladder<br />
employment.<br />
5 Source: Brookings-Battelle Clean Economy Database (See<br />
Brookings - Sizing the Green Economy)<br />
Environmental Justice and Mitigation<br />
One of the reasons that property is so affordable<br />
relative to other areas of the greater Los Angeles<br />
region has been the history of industrial, sometimes<br />
dirty industrial, development in the <strong>Northeast</strong> <strong>Valley</strong>.<br />
Drawn by lower rents, Lower SES households move<br />
to the region—often doubling or tripling up in housing<br />
units to afford even the most reasonable rents<br />
they can find. This has added to the environmental<br />
justice challenge for the residents of these communities.<br />
This plan proposes to directly address this strategy<br />
by (1) drawing new businesses into the communities<br />
who, as part of their location in the area, will<br />
mitigate some of the issues caused by past economic<br />
activity, and (2) bringing new technologies<br />
on line to turn the region’s landfills, “brownfields”<br />
and “grayfields” into net community assets by their<br />
providing employment and income as well.<br />
As the region builds a capacity and a reputation<br />
as a green innovation center, the ability to mitigate<br />
the prior uses of many of the parcels of the region<br />
act as a resource for the community demonstrating<br />
what is possible for cities and communities elsewhere.<br />
For example, imagine repurposing a former<br />
sand and gravel pit/landfill into a super high-yield<br />
photovoltaic array generating solar electricity for the<br />
neighboring businesses. In the next step, proceeds<br />
are used, not only to generate returns to its investors,<br />
but also to reinvest in workforce development<br />
and after-school programs for the people who work<br />
in those businesses.<br />
There are other innovation models possible for<br />
the Sun <strong>Valley</strong> region in particular. Expanded<br />
integration of landfill gas generation power plants,<br />
for example, not only creates new energy from a<br />
renewable resource, but can significantly reduce<br />
emissions of methane gas, which is one of the most<br />
destructive of the greenhouse gases.<br />
High Unmet Demand for Public Transit<br />
The <strong>Northeast</strong> <strong>Valley</strong> generally has a lower Socioeconomic<br />
Status than the rest of the <strong>Valley</strong> and<br />
most of Los Angeles. Unfortunately, it tends to be<br />
left out of strategic thinking partly because it isn’t<br />
contiguous with other poverty pockets in Los Angeles,<br />
and partly because it is physically remote.<br />
Nonetheless, it is an excellent candidate for SB 375<br />
GHG reductions. With a 35 percent transit dependency,<br />
several hundred thousand residents, and a<br />
very long haul to the Los Angeles Basin, residents<br />
are more in need of transit than most in the county.<br />
80 Page www.<strong>Northeast</strong>Strategy.org<br />
Draft Revision I - May 25, 2016<br />
Page 81