

Northeast San Fernando Valley
NEV%20Strategy%20Publication%20Draft%20Revision%20I
NEV%20Strategy%20Publication%20Draft%20Revision%20I

You also want an ePaper? Increase the reach of your titles
YUMPU automatically turns print PDFs into web optimized ePapers that Google loves.
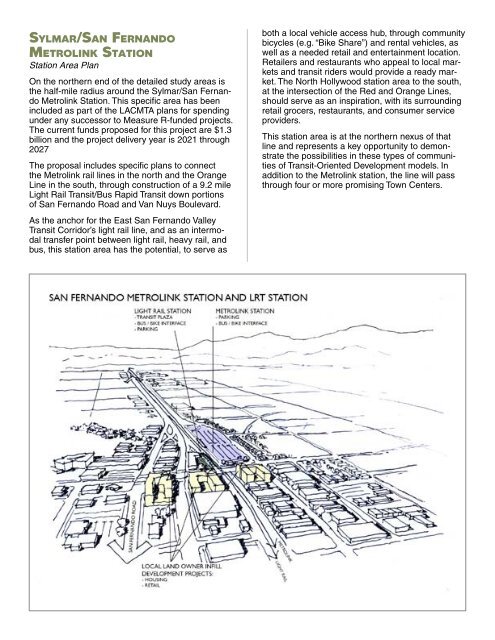
Sylmar/<strong>San</strong> <strong>Fernando</strong><br />
Metrolink Station<br />
Station Area Plan<br />
On the northern end of the detailed study areas is<br />
the half-mile radius around the Sylmar/<strong>San</strong> <strong>Fernando</strong><br />
Metrolink Station. This specific area has been<br />
included as part of the LACMTA plans for spending<br />
under any successor to Measure R-funded projects.<br />
The current funds proposed for this project are $1.3<br />
billion and the project delivery year is 2021 through<br />
2027<br />
The proposal includes specific plans to connect<br />
the Metrolink rail lines in the north and the Orange<br />
Line in the south, through construction of a 9.2 mile<br />
Light Rail Transit/Bus Rapid Transit down portions<br />
of <strong>San</strong> <strong>Fernando</strong> Road and Van Nuys Boulevard.<br />
As the anchor for the East <strong>San</strong> <strong>Fernando</strong> <strong>Valley</strong><br />
Transit Corridor’s light rail line, and as an intermodal<br />
transfer point between light rail, heavy rail, and<br />
bus, this station area has the potential, to serve as<br />
both a local vehicle access hub, through community<br />
bicycles (e.g. “Bike Share”) and rental vehicles, as<br />
well as a needed retail and entertainment location.<br />
Retailers and restaurants who appeal to local markets<br />
and transit riders would provide a ready market.<br />
The North Hollywood station area to the south,<br />
at the intersection of the Red and Orange Lines,<br />
should serve as an inspiration, with its surrounding<br />
retail grocers, restaurants, and consumer service<br />
providers.<br />
This station area is at the northern nexus of that<br />
line and represents a key opportunity to demonstrate<br />
the possibilities in these types of communities<br />
of Transit-Oriented Development models. In<br />
addition to the Metrolink station, the line will pass<br />
through four or more promising Town Centers.<br />
790 3,218<br />
32<br />
U.S. Census Bureau. 2015. OnTheMap Application. Longitudinal-Employer<br />
Household Dynamics Program. http://onthemap.ces.census.gov/<br />
Employed and Living<br />
in the Selection Area<br />
Employed in the Selection Area<br />
and Living Elsewhere<br />
Living in the Selection Area<br />
and Employed Elsewhere<br />
Overlay Arrows do not Indicate<br />
Directionality of Flow<br />
Sylmar/<strong>San</strong> <strong>Fernando</strong> Metrolink Station<br />
Centroid with Half-Mile Radius/Band<br />
RESIDENT AREA PROFILE REPORT<br />
SYLMAR/SAN FERNANDO METROLINK STATION<br />
Total Primary Jobs 2013 Count Share<br />
Total Primary Jobs 3,250 100.0%<br />
Jobs by Worker Age 2013 Count Share<br />
Age 29 or younger 790 24.3%<br />
Age 30 to 54 1,843 56.7%<br />
Age 55 or older 617 19.0%<br />
Jobs by Earnings 2013 Count Share<br />
$1,250 per month or less 620 19.1%<br />
$1,251 to $3,333 per month 1,497 46.1%<br />
More than $3,333 per month 1,133 34.9%<br />
Jobs by NAICS Industry Sector 2013 Count Share<br />
Agriculture, Forestry, Fishing and Hunting 29 0.9%<br />
Mining, Quarrying, & Oil & Gas Extraction 1 0.0%<br />
Utilities 27 0.8%<br />
Construction 163 5.0%<br />
Manufacturing 451 13.9%<br />
Wholesale Trade 151 4.6%<br />
Retail Trade 419 12.9%<br />
Transportation and Warehousing 84 2.6%<br />
Information 93 2.9%<br />
Finance and Insurance 113 3.5%<br />
Real Estate and Rental and Leasing 57 1.8%<br />
Professional, Scientific, & Tech Services 178 5.5%<br />
Management of Companies & Enterprises 52 1.6%<br />
Administration & Support, Waste<br />
Management and Remediation 204 6.3%<br />
Educational Services 258 7.9%<br />
Health Care and Social Assistance 463 14.2%<br />
Arts, Entertainment, and Recreation 42 1.3%<br />
Accommodation and Food Services 253 7.8%<br />
Other Services (excluding Public Admin) 95 2.9%<br />
Public Administration 117 3.6%<br />
Jobs by Worker Race 2013 Count Share<br />
White Alone 2,673 82.2%<br />
Black or African American Alone 142 4.4%<br />
American Indian or Alaska Native Alone 62 1.9%<br />
Asian Alone 312 9.6%<br />
Native Hawaiian or Otr Pac Islander Alone 4 0.1%<br />
Two or More Race Groups 57 1.8%<br />
Jobs by Worker Ethnicity 2013 Count Share<br />
Not Hispanic or Latino 1,134 34.9%<br />
Hispanic or Latino 2,116 65.1%<br />
Jobs by Distance - Resident Census<br />
Jobs by Distance - Home Census Block<br />
to Work<br />
Block<br />
Census<br />
to Work<br />
Block<br />
Census Block<br />
2013<br />
Count Share<br />
Total Primary Jobs 3,250 100.0%<br />
Less than 10 miles 1,250 38.5%<br />
10 to 24 miles 1,209 37.2%<br />
25 to 50 miles 472 14.5%<br />
Jobs by Worker Educational Attainment 2013<br />
Count Share<br />
Less than high school 728 22.4%<br />
High school or equivalent, no college 481 14.8%<br />
Some college or Associate degree 685 21.1%<br />
Bachelor's degree or advanced degree 566 17.4%<br />
Educational attainment not available<br />
(workers aged 29 or younger) 790 24.3%<br />
Jobs by Worker Sex 2013 Count Share<br />
Male 1,688 51.9%<br />
Female 1,562 48.1%<br />
Sylmar/<strong>San</strong> <strong>Fernando</strong> Metrolink Station<br />
www.<strong>Northeast</strong>Strategy.org<br />
Greater than 50 miles 319 9.8%