

Northeast San Fernando Valley
NEV%20Strategy%20Publication%20Draft%20Revision%20I
NEV%20Strategy%20Publication%20Draft%20Revision%20I

You also want an ePaper? Increase the reach of your titles
YUMPU automatically turns print PDFs into web optimized ePapers that Google loves.
<strong>San</strong> <strong>Fernando</strong> Road and Mall Area<br />
<strong>San</strong> <strong>Fernando</strong> Road and Mall Area<br />
Centroid with Half-Mile Radius/Band<br />
RESIDENT AREA PROFILE REPORT<br />
SAN FERNANDO ROAD - MALL<br />
Total Primary Jobs 2013 Count Share<br />
Total Primary Jobs 7,446 100.0%<br />
Jobs by Worker Age 2013 Count Share<br />
Age 29 or younger 1,800 24.2%<br />
Age 30 to 54 4,270 57.3%<br />
Age 55 or older 1,376 18.5%<br />
Jobs by Earnings 2013 Count Share<br />
$1,250 per month or less 1,436 19.3%<br />
$1,251 to $3,333 per month 3,614 48.5%<br />
More than $3,333 per month 2,396 32.2%<br />
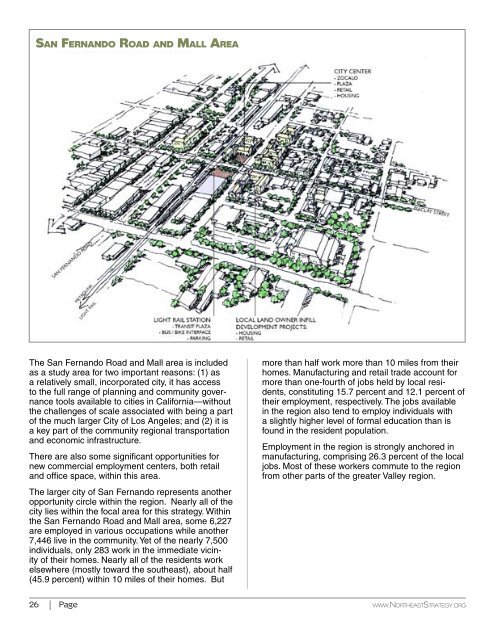
The <strong>San</strong> <strong>Fernando</strong> Road and Mall area is included<br />
as a study area for two important reasons: (1) as<br />
a relatively small, incorporated city, it has access<br />
to the full range of planning and community governance<br />
tools available to cities in California—without<br />
the challenges of scale associated with being a part<br />
of the much larger City of Los Angeles; and (2) it is<br />
a key part of the community regional transportation<br />
and economic infrastructure.<br />
There are also some significant opportunities for<br />
new commercial employment centers, both retail<br />
and office space, within this area.<br />
more than half work more than 10 miles from their<br />
homes. Manufacturing and retail trade account for<br />
more than one-fourth of jobs held by local residents,<br />
constituting 15.7 percent and 12.1 percent of<br />
their employment, respectively. The jobs available<br />
in the region also tend to employ individuals with<br />
a slightly higher level of formal education than is<br />
found in the resident population.<br />
Employment in the region is strongly anchored in<br />
manufacturing, comprising 26.3 percent of the local<br />
jobs. Most of these workers commute to the region<br />
from other parts of the greater <strong>Valley</strong> region.<br />
5,944 7,163<br />
283<br />
U.S. Census Bureau. 2015. OnTheMap Application. Longitudinal-Employer<br />
Household Dynamics Program. http://onthemap.ces.census.gov/<br />
Employed and Living<br />
in the Selection Area<br />
Employed in the Selection Area<br />
and Living Elsewhere<br />
Living in the Selection Area<br />
and Employed Elsewhere<br />
Overlay Arrows do not Indicate<br />
Directionality of Flow<br />
Jobs by NAICS Industry Sector 2013 Count Share<br />
Agriculture, Forestry, Fishing & Hunting 68 0.9%<br />
Mining, Quarrying, & Oil & Gas Extraction 1 0.0%<br />
Utilities 61 0.8%<br />
Construction 390 5.2%<br />
Manufacturing 1,167 15.7%<br />
Wholesale Trade 376 5.0%<br />
Retail Trade 904 12.1%<br />
Transportation and Warehousing 197 2.6%<br />
Information 209 2.8%<br />
Finance and Insurance 261 3.5%<br />
Real Estate and Rental and Leasing 122 1.6%<br />
Professional, Scientific, & Tech Services 355 4.8%<br />
Mgmt of Companies & Enterprises 113 1.5%<br />
Administration & Support, Waste<br />
Management and Remediation 489 6.6%<br />
Educational Services 573 7.7%<br />
Health Care and Social Assistance 998 13.4%<br />
Arts, Entertainment, and Recreation 96 1.3%<br />
Accommodation and Food Services 574 7.7%<br />
Other Services (excluding<br />
Public Administration) 250 3.4%<br />
Public Administration 242 3.3%<br />
Jobs by Worker Race 2013 Count Share<br />
White Alone 6,456 86.7%<br />
Black or African American Alone 270 3.6%<br />
American Indian or Alaska Native Alone 120 1.6%<br />
Asian Alone 473 6.4%<br />
Native Hawaiian or Otr Pac Islander Alone 16 0.2%<br />
Two or More Race Groups 111 1.5%<br />
Jobs by Worker Ethnicity 2013 Count Share<br />
Not Hispanic or Latino 1,935 26.0%<br />
Hispanic or Latino 5,511 74.0%<br />
The larger city of <strong>San</strong> <strong>Fernando</strong> represents another<br />
opportunity circle within the region. Nearly all of the<br />
city lies within the focal area for this strategy. Within<br />
the <strong>San</strong> <strong>Fernando</strong> Road and Mall area, some 6,227<br />
are employed in various occupations while another<br />
7,446 live in the community. Yet of the nearly 7,500<br />
individuals, only 283 work in the immediate vicinity<br />
of their homes. Nearly all of the residents work<br />
elsewhere (mostly toward the southeast), about half<br />
(45.9 percent) within 10 miles of their homes. But<br />
Jobs by Distance - Resident Census<br />
Jobs by Distance - Home Census Block<br />
to Work Block Census to Work Block Census Block<br />
Count<br />
2013<br />
Share<br />
Total Primary Jobs 7,446 100.0%<br />
Less than 10 miles 3,414 45.9%<br />
10 to 24 miles 2,766 37.1%<br />
25 to 50 miles 889 11.9%<br />
Greater than 50 miles 377 5.1%<br />
Jobs by Worker Educational Attainment 2013<br />
Count Share<br />
Less than high school 1,801 24.2%<br />
High school or equivalent, no college 1,179 15.8%<br />
Some college or Associate degree 1,547 20.8%<br />
Bachelor's degree or advanced degree 1,119 15.0%<br />
Educational attainment not available<br />
(workers aged 29 or younger) 1,800 24.2%<br />
Jobs by Worker Sex 2013 Count Share<br />
Male 3,870 52.0%<br />
Female 3,576 48.0%<br />
26 Page www.<strong>Northeast</strong>Strategy.org