

4108 Deeboyar Ave Positioning Analysis

You also want an ePaper? Increase the reach of your titles
YUMPU automatically turns print PDFs into web optimized ePapers that Google loves.
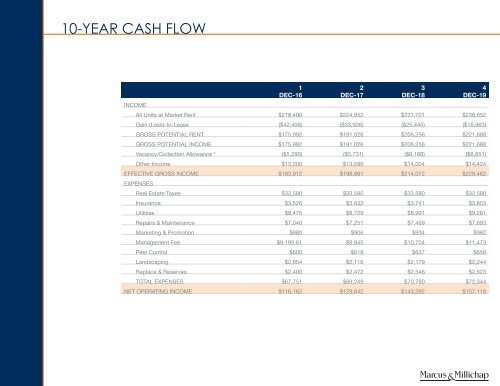
10-YEAR CASH FLOW<br />
INCOME<br />
1 2 3 4<br />
DEC-16 DEC-17 DEC-18 DEC-19<br />
All Units at Market Rent $218,400 $224,952 $231,701 $238,652<br />
Gain (Loss)-to-Lease ($42,408) ($33,926) ($25,445) ($16,963)<br />
GROSS POTENTIAL RENT $175,992 $191,026 $206,256 $221,688<br />
GROSS POTENTIAL INCOME $175,992 $191,026 $206,256 $221,688<br />
Vacancy/Collection Allowance * ($5,280) ($5,731) ($6,188) ($6,651)<br />
Other Income $13,200 $13,596 $14,004 $14,424<br />
EFFECTIVE GROSS INCOME $183,912 $198,891 $214,072 $229,462<br />
EXPENSES<br />
Real Estate Taxes $33,580 $33,580 $33,580 $33,580<br />
Insurance $3,526 $3,632 $3,741 $3,853<br />
Utilities $8,475 $8,729 $8,991 $9,261<br />
Repairs & Maintenance $7,040 $7,251 $7,469 $7,693<br />
Marketing & Promotion $880 $906 $934 $962<br />
Management Fee $9,195.61 $9,945 $10,704 $11,473<br />
Pest Control $600 $618 $637 $656<br />
Landscaping $2,054 $2,116 $2,179 $2,244<br />
Replace & Reserves $2,400 $2,472 $2,546 $2,623<br />
TOTAL EXPENSES $67,751 $69,249 $70,780 $72,344<br />
NET OPERATING INCOME $116,162 $129,642 $143,292 $157,118<br />
18