4108 Deeboyar Ave Positioning Analysis
Create successful ePaper yourself
Turn your PDF publications into a flip-book with our unique Google optimized e-Paper software.
DEMOGRAPHIC SUMMARY<br />
POPULATION<br />
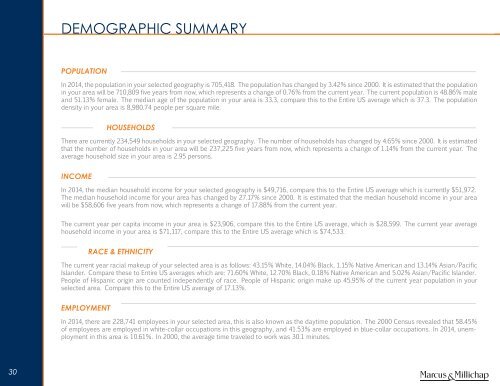
In 2014, the population in your selected geography is 705,418. The population has changed by 3.42% since 2000. It is estimated that the population<br />
in your area will be 710,809 five years from now, which represents a change of 0.76% from the current year. The current population is 48.86% male<br />
and 51.13% female. The median age of the population in your area is 33.3, compare this to the Entire US average which is 37.3. The population<br />
density in your area is 8,980.74 people per square mile.<br />
HOUSEHOLDS<br />
There are currently 234,549 households in your selected geography. The number of households has changed by 4.65% since 2000. It is estimated<br />
that the number of households in your area will be 237,225 five years from now, which represents a change of 1.14% from the current year. The<br />
average household size in your area is 2.95 persons.<br />
INCOME<br />
In 2014, the median household income for your selected geography is $49,716, compare this to the Entire US average which is currently $51,972.<br />
The median household income for your area has changed by 27.17% since 2000. It is estimated that the median household income in your area<br />
will be $58,606 five years from now, which represents a change of 17.88% from the current year.<br />
The current year per capita income in your area is $23,906, compare this to the Entire US average, which is $28,599. The current year average<br />
household income in your area is $71,117, compare this to the Entire US average which is $74,533.<br />
RACE & ETHNICITY<br />
The current year racial makeup of your selected area is as follows: 43.15% White, 14.04% Black, 1.15% Native American and 13.14% Asian/Pacific<br />
Islander. Compare these to Entire US averages which are: 71.60% White, 12.70% Black, 0.18% Native American and 5.02% Asian/Pacific Islander.<br />
People of Hispanic origin are counted independently of race. People of Hispanic origin make up 45.95% of the current year population in your<br />
selected area. Compare this to the Entire US average of 17.13%.<br />
EMPLOYMENT<br />
In 2014, there are 228,741 employees in your selected area, this is also known as the daytime population. The 2000 Census revealed that 58.45%<br />
of employees are employed in white-collar occupations in this geography, and 41.53% are employed in blue-collar occupations. In 2014, unemployment<br />
in this area is 10.61%. In 2000, the average time traveled to work was 30.1 minutes.<br />
30


