

4108 Deeboyar Ave Positioning Analysis

You also want an ePaper? Increase the reach of your titles
YUMPU automatically turns print PDFs into web optimized ePapers that Google loves.
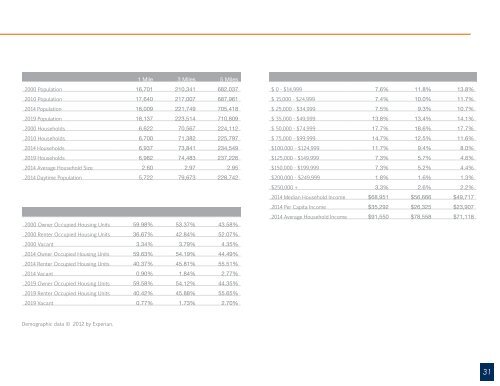
1 Mile 3 Miles 5 Miles<br />
2000 Population 16,701 210,341 682,037<br />
2010 Population 17,640 217,007 687,961<br />
2014 Population 18,009 221,749 705,418<br />
2019 Population 18,137 223,514 710,809<br />
2000 Households 6,622 70,567 224,112<br />
2010 Households 6,700 71,382 225,797<br />
2014 Households 6,937 73,841 234,549<br />
2019 Households 6,982 74,483 237,226<br />
2014 <strong>Ave</strong>rage Household Size 2.60 2.97 2.95<br />
2014 Daytime Population 5,722 79,673 228,742<br />
2000 Owner Occupied Housing Units 59.98% 53.37% 43.58%<br />
2000 Renter Occupied Housing Units 36.67% 42.84% 52.07%<br />
2000 Vacant 3.34% 3.79% 4.35%<br />
2014 Owner Occupied Housing Units 59.63% 54.19% 44.49%<br />
2014 Renter Occupied Housing Units 40.37% 45.81% 55.51%<br />
2014 Vacant 0.90% 1.84% 2.77%<br />
2019 Owner Occupied Housing Units 59.58% 54.12% 44.35%<br />
2019 Renter Occupied Housing Units 40.42% 45.88% 55.65%<br />
2019 Vacant 0.77% 1.73% 2.70%<br />
$ 0 - $14,999 7.6% 11.8% 13.8%<br />
$ 15,000 - $24,999 7.4% 10.0% 11.7%<br />
$ 25,000 - $34,999 7.5% 9.3% 10.7%<br />
$ 35,000 - $49,999 13.8% 13.4% 14.1%<br />
$ 50,000 - $74,999 17.7% 18.6% 17.7%<br />
$ 75,000 - $99,999 14.7% 12.5% 11.6%<br />
$100,000 - $124,999 11.7% 9.4% 8.0%<br />
$125,000 - $149,999 7.3% 5.7% 4.6%<br />
$150,000 - $199,999 7.3% 5.2% 4.4%<br />
$200,000 - $249,999 1.8% 1.6% 1.3%<br />
$250,000 + 3.3% 2.6% 2.2%<br />
2014 Median Household Income $68,951 $56,666 $49,717<br />
2014 Per Capita Income $35,292 $26,325 $23,907<br />
2014 <strong>Ave</strong>rage Household Income $91,550 $78,558 $71,118<br />
Demographic data © 2012 by Experian.<br />
31