
Create successful ePaper yourself
Turn your PDF publications into a flip-book with our unique Google optimized e-Paper software.
JULY <strong>2016</strong><br />
STOCK PICKS<br />
Godrej Properties Ltd<br />
CMP: Rs 365<br />
Rating: BUY Target: Rs 415<br />
Company Information<br />
Sector<br />
Real Estate<br />
Price (Rs.) 336<br />
Rating<br />
Buy<br />
Target 415<br />
Time Frame<br />
12-18 months<br />
BSE Code 533150<br />
NSE Code<br />
GodrejProp<br />
Bloomberg Code<br />
GPL IN<br />
Market Cap (Rs. Cr) 7910<br />
Outstanding shares(Cr) 21.6<br />
Free Float (%) 29.12<br />
52-wk Hi/Lo (Rs) 375/239.4<br />
NSE 1yr volume 49252693<br />
Face Value (Rs.) 5<br />
BVPS (Rs.) 100.26<br />
400<br />
300<br />
200<br />
100<br />
0<br />
Jun-15<br />
Source: Bloomberg<br />
Jul-15<br />
Godrej Properties share price<br />
Aug-15<br />
Sep-15<br />
Oct-15<br />
Nov-15<br />
Dec-15<br />
Jan-16<br />
Feb-16<br />
Mar-16<br />
Apr-16<br />
May-16<br />
Share holding pattern as on Mar <strong>2016</strong> (%)<br />
Jun-16<br />
Company Profile<br />
Godrej Properties Limited (GPL) is an India-based real<br />
estate company (headquartered in Mumbai) and is a<br />
subsidiary of Godrej Group. The company has projects in<br />
approximately 12 cities and it is involved in the<br />
development of residential and commercial real estate. Its<br />
residential portfolio consists of accommodations of varying<br />
sizes. The commercial portfolio includes building office<br />
space catering to blue-chip Indian and international<br />
companies, IT parks catering to the requirements of IT/ITES<br />
companies and retail space. Godrej Properties has been<br />
expanding its footprints at a fast pace and has sold real<br />
estate worth US $ 2.1 bn over the last four years.<br />
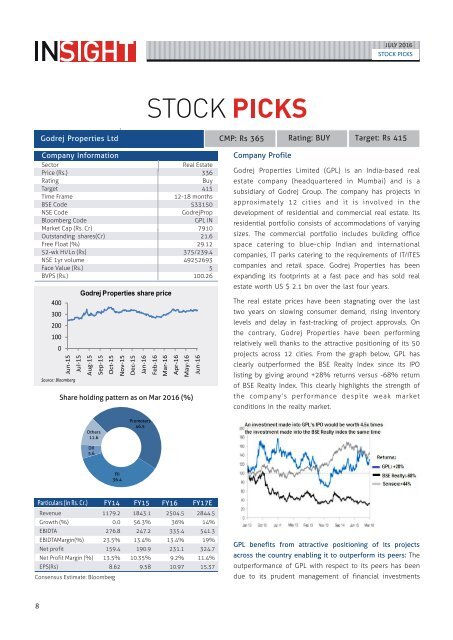
The real estate prices have been stagnating over the last<br />
two years on slowing consumer demand, rising inventory<br />
levels and delay in fast-tracking of project approvals. On<br />
the contrary, Godrej Properties have been performing<br />
relatively well thanks to the attractive positioning of its 50<br />
projects across 12 cities. From the graph below, GPL has<br />
clearly outperformed the BSE Realty Index since its IPO<br />
listing by giving around +28% returns versus -68% return<br />
of BSE Realty Index. This clearly highlights the strength of<br />
the company’s performance despite weak market<br />
conditions in the realty market.<br />
Others<br />
11.6<br />
Promoters<br />
46.5<br />
DII<br />
5.6<br />
FII<br />
36.4<br />
Particulars (in Rs. Cr.) FY14 FY15 FY16 FY17E<br />
Revenue 1179.2 1843.1 2504.5 2844.5<br />
Growth (%) 0.0 56.3% 36% 14%<br />
EBIDTA 276.8 247.2 335.4 541.3<br />
EBIDTAMargin(%) 23.5% 13.4% 13.4% 19%<br />
Net profit 159.4 190.9 231.1 324.7<br />
Net Profit Margin (%) 13.5% 10.35% 9.2% 11.4%<br />
EPS(Rs) 8.62 9.58 10.97 15.37<br />
Consensus Estimate: Bloomberg<br />
GPL benefits from attractive positioning of its projects<br />
across the country enabling it to outperform its peers: The<br />
outperformance of GPL with respect to its peers has been<br />
due to its prudent management of financial investments<br />
8