
You also want an ePaper? Increase the reach of your titles
YUMPU automatically turns print PDFs into web optimized ePapers that Google loves.
FDI - WINDOW OF OPPORTUNITY<br />
Average amount of water needed to grow crops in (Cubic Meters / Tonne)<br />
Brazil India China<br />
United<br />
States<br />
Rice 3,082 2,800 1,321 1,275<br />
Sugarcane 155 159 117 103<br />
Wheat 1,616 1,654 690 849<br />
Cotton 2,777 8,264 1,419 2,535<br />
Sources: National Water Footprint Account, UNESCO-Institute for<br />
Water Education, May 2011; PRS<br />
A realignment of the different regions and cultivation of<br />
crops should be based on regions which are naturally<br />
water abundant. Nevertheless, in a country like India, the<br />
structural reforms are hard to come by and rather happen<br />
at a snail’s pace. The key element for implementation of<br />
swift reforms has to be the strong urgency which is<br />
hardly seen in agriculture sector. Thus, the inter-linkage<br />
between monsoon, sowing, food production, import, food<br />
inflation, MSP of crops and its final impact on CPI<br />
inflation cannot be ignored. However, last year’s food<br />
production figures have been better than previous year<br />
(albeit by an iota), despite poor monsoon and drying up<br />
of reservoirs. Food grain production for 2015-16 crop<br />
year increased marginally to 252.23 million tonnes,<br />
according to third advance estimates. Although, food<br />
production of coarse cereals, rice, oilseeds and sugarcane<br />
was significantly lower than last year. With the rise in<br />
population, the per capita demand for food grains is on<br />
the rise. To cope up with the demand, in the face of<br />
rising demand, the government has to resort to imports of<br />
cereals, pulses. However, despite these measures, lack of<br />
supply side reforms largely leads to higher food price<br />
inflation and consequently high retail inflation.<br />
Food production (in million tonnes)<br />
2015-16<br />
2014-15 % Change<br />
Rice 103.36 105.48 -2.01<br />
Wheat 94.04 86.53 8.68<br />
Coarse cereals 37.78 42.86 -11.85<br />
Pulses 17.06 17.15 -0.52<br />
Oilseeds 25.9 27.5 -5.82<br />
Sugarcane 346.72 362.33 -4.31<br />
Total 252.23 252.02 0.08<br />
Source: Ministry of Agriculture, Economic Times<br />
For instance, the prices of the key pulses – Tur, and Urad<br />
have been often blamed for the overall increase in food<br />
inflation in India. According to Crisil analysis, the price of<br />
pulses spikes every third year (based on data taken for a<br />
decade). However, this has a lot to do with the lower<br />
yield or productivity of the crop which has not made any<br />
major improvements to keep up with the rising demand.<br />
The per hectare productivity of pulses in FY14 was just<br />
764 tonnes which is poor when compared to wheat<br />
(3,075 tones), rice (2,424 tones) and sugarcane (69,838<br />
tones). The production of pulses declined both in 2014-15<br />
and 2015-16, understandably when the monsoon has been<br />
under deficit for the last two years. One of the reasons<br />
why the pulses production is so vulnerable to monsoon is<br />
explained by the poor irrigation coverage for the crop<br />
which stands abysmally low at 16%. The national average<br />
irrigation coverage is ~45% and most of the other food<br />
items are above that threshold mark. For instance,<br />
irrigation coverage is highest for sugarcane (90%) while<br />
Wheat and rice also enjoy good irrigation coverage of over<br />
50%. To make up for the shortfall in production, the<br />
government has to resort to imports. The imports in<br />
volumes have been on the rise for the last two years, thus<br />
the sustained increase in food prices component in both<br />
WPI and CPI. The imports for <strong>2016</strong>-17 have been<br />
estimated to be lower than previous year figures. The<br />
notion will probably again be above average monsoon.<br />
However, a disappointment on that front can easily push<br />
the prices higher and thus food inflation and adjoining CPI.<br />
The prices of major pulses – Chickpeas, Lentil, Tur, Urad<br />
and Moong have all exhibited higher trend almost in line<br />
with international prices. Besides, the minimum support<br />
price (MSP) of the list of major pulses also witnessed<br />
significant appreciation in the last five years. These factors<br />
will certainly put heavy pressure on the inflation numbers<br />
unless the production numbers prop up for <strong>2016</strong>-17.<br />
Pulses Production, Trade, and Consumption of India (million tonnes)<br />
2013-14 2014-15 2015-16 <strong>2016</strong>-17*<br />
Production 19.78 17.15 17.06 17.82<br />
Total Imports 3.65 4.58 5.79 4.67<br />
Availability 23.43 21.73 22.85 22.49<br />
Total Exports 0.34 0.22 0.25 0.27<br />
Total Availability<br />
for Domestic<br />
Consumption 23.09 21.51 22.6 22.22<br />
Source: Ministry of Agriculture, <strong>Ashika</strong> Research,* estimated figures<br />
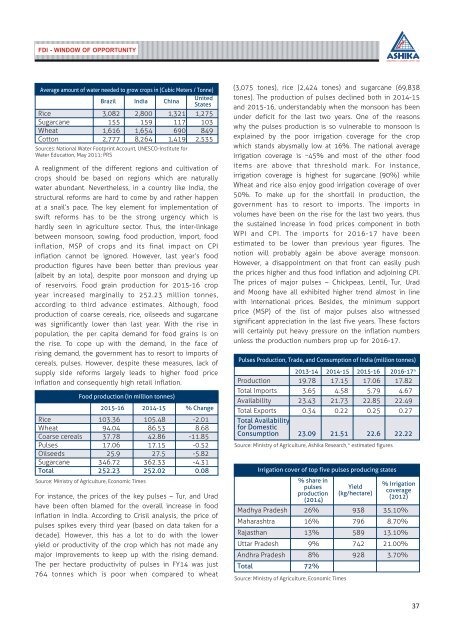
Irrigation cover of top five pulses producing states<br />
% share in<br />
pulses<br />
production<br />
(2014)<br />
Madhya Pradesh 26% 938 35.10%<br />
Maharashtra 16% 796 8.70%<br />
Rajasthan 13% 589 13.10%<br />
Uttar Pradesh 9% 742 21.00%<br />
Andhra Pradesh 8% 928 3.70%<br />
Total 72%<br />
Source: Ministry of Agriculture, Economic Times<br />
Yield<br />
(kg/hectare)<br />
% Irrigation<br />
coverage<br />
(2012)<br />
37