

Date
digital-day-2016-chart-deck-children-aged-6-15-in-the-uk
digital-day-2016-chart-deck-children-aged-6-15-in-the-uk

You also want an ePaper? Increase the reach of your titles
YUMPU automatically turns print PDFs into web optimized ePapers that Google loves.
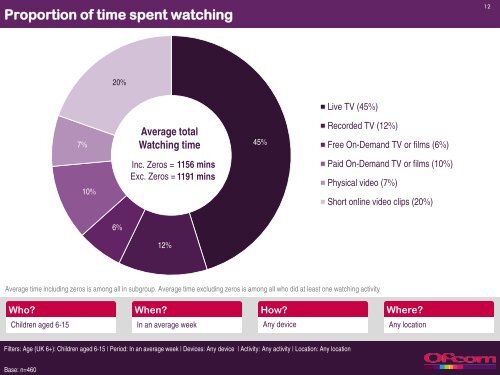
Proportion of time spent watching<br />
12<br />
20%<br />
Live TV (45%)<br />
7%<br />
Average total<br />
Watching time<br />
45%<br />
Recorded TV (12%)<br />
Free On-Demand TV or films (6%)<br />
10%<br />
Inc. Zeros = 1156 mins<br />
Exc. Zeros = 1191 mins<br />
Paid On-Demand TV or films (10%)<br />
Physical video (7%)<br />
Short online video clips (20%)<br />
6%<br />
12%<br />
Average time including zeros is among all in subgroup. Average time excluding zeros is among all who did at least one watching activity<br />
Who? When? How? Where?<br />
Children aged 6-15 In an average week Any device Any location<br />
Filters: Age (UK 6+): Children aged 6-15 | Period: In an average week | Devices: Any device | Activity: Any activity | Location: Any location<br />
Base: n=460