IJIFR VOLUME 3 ISSUE 12 AUGUST 2016
RESEARCH PAPER
RESEARCH PAPER

You also want an ePaper? Increase the reach of your titles
YUMPU automatically turns print PDFs into web optimized ePapers that Google loves.
Expt.<br />
No<br />
ISSN: 2347-1697<br />
International Journal of Informative & Futuristic Research (<strong>IJIFR</strong>)<br />
Volume - 3, Issue -<strong>12</strong>, August <strong>2016</strong><br />
Continuous 36 th Edition, Page No: 4537-4550<br />
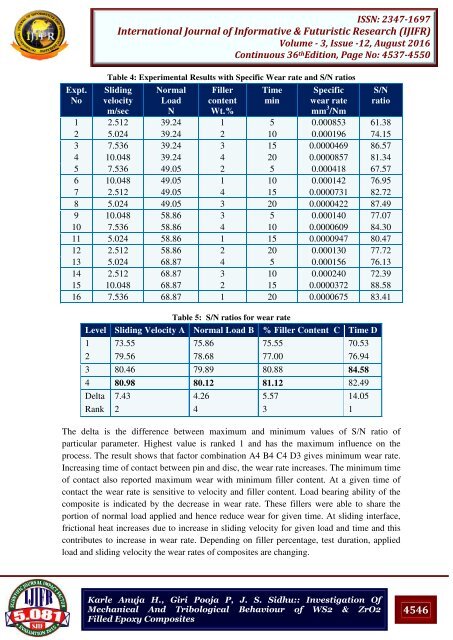
Table 4: Experimental Results with Specific Wear rate and S/N ratios<br />
Sliding<br />
velocity<br />
m/sec<br />
Normal<br />
Load<br />
N<br />
Filler<br />
content<br />
Wt.%<br />
Time<br />
min<br />
Specific<br />
wear rate<br />
mm 3 /Nm<br />
S/N<br />
ratio<br />
1 2.5<strong>12</strong> 39.24 1 5 0.000853 61.38<br />
2 5.024 39.24 2 10 0.000196 74.15<br />
3 7.536 39.24 3 15 0.0000469 86.57<br />
4 10.048 39.24 4 20 0.0000857 81.34<br />
5 7.536 49.05 2 5 0.000418 67.57<br />
6 10.048 49.05 1 10 0.000142 76.95<br />
7 2.5<strong>12</strong> 49.05 4 15 0.0000731 82.72<br />
8 5.024 49.05 3 20 0.0000422 87.49<br />
9 10.048 58.86 3 5 0.000140 77.07<br />
10 7.536 58.86 4 10 0.0000609 84.30<br />
11 5.024 58.86 1 15 0.0000947 80.47<br />
<strong>12</strong> 2.5<strong>12</strong> 58.86 2 20 0.000130 77.72<br />
13 5.024 68.87 4 5 0.000156 76.13<br />
14 2.5<strong>12</strong> 68.87 3 10 0.000240 72.39<br />
15 10.048 68.87 2 15 0.0000372 88.58<br />
16 7.536 68.87 1 20 0.0000675 83.41<br />
Table 5: S/N ratios for wear rate<br />
Level Sliding Velocity A Normal Load B % Filler Content C Time D<br />
1 73.55 75.86 75.55 70.53<br />
2 79.56 78.68 77.00 76.94<br />
3 80.46 79.89 80.88 84.58<br />
4 80.98 80.<strong>12</strong> 81.<strong>12</strong> 82.49<br />
Delta 7.43 4.26 5.57 14.05<br />
Rank 2 4 3 1<br />
The delta is the difference between maximum and minimum values of S/N ratio of<br />
particular parameter. Highest value is ranked 1 and has the maximum influence on the<br />
process. The result shows that factor combination A4 B4 C4 D3 gives minimum wear rate.<br />
Increasing time of contact between pin and disc, the wear rate increases. The minimum time<br />
of contact also reported maximum wear with minimum filler content. At a given time of<br />
contact the wear rate is sensitive to velocity and filler content. Load bearing ability of the<br />
composite is indicated by the decrease in wear rate. These fillers were able to share the<br />
portion of normal load applied and hence reduce wear for given time. At sliding interface,<br />
frictional heat increases due to increase in sliding velocity for given load and time and this<br />
contributes to increase in wear rate. Depending on filler percentage, test duration, applied<br />
load and sliding velocity the wear rates of composites are changing.<br />
Karle Anuja H., Giri Pooja P, J. S. Sidhu:: Investigation Of<br />
Mechanical And Tribological Behaviour of WS2 & ZrO2<br />
Filled Epoxy Composites<br />
4546