Understanding patient flow in hospitals
understanding_patient_flow_in_hospitals_web_0
understanding_patient_flow_in_hospitals_web_0

Create successful ePaper yourself
Turn your PDF publications into a flip-book with our unique Google optimized e-Paper software.
14 <strong>Understand<strong>in</strong>g</strong> <strong>patient</strong> <strong>flow</strong> <strong>in</strong> <strong>hospitals</strong><br />
Identify<strong>in</strong>g the space needed<br />
for <strong>flow</strong><br />
We now move on to consider the space needed for <strong>flow</strong>, and how this tends to be<br />
understood – and misunderstood. Bear<strong>in</strong>g <strong>in</strong> m<strong>in</strong>d the <strong>in</strong>crease <strong>in</strong> <strong>patient</strong>s not stay<strong>in</strong>g<br />
overnight, we look at the problems <strong>in</strong>herent <strong>in</strong> us<strong>in</strong>g midnight censuses to judge<br />
occupancy, the ‘rush hour’ effect of short-stay and day <strong>patient</strong>s, and the importance of<br />
housekeep<strong>in</strong>g. We also <strong>in</strong>troduce the concepts of peak occupancy and peak <strong>flow</strong> and<br />
consider how much capacity is needed to manage <strong>flow</strong>.<br />
We show that more space is needed for <strong>patient</strong>s to travel through the system faster. We<br />
estimate the impact of not provid<strong>in</strong>g this space on the emergency department and the<br />
four-hour target. We deal with the follow<strong>in</strong>g issues <strong>in</strong> turn:<br />
• Impact of peak occupancy and peak <strong>flow</strong><br />
• The challenge of achiev<strong>in</strong>g early discharge<br />
• The consequences of not provid<strong>in</strong>g <strong>flow</strong> capacity.<br />
How much space do we have? The annual activity cycle<br />
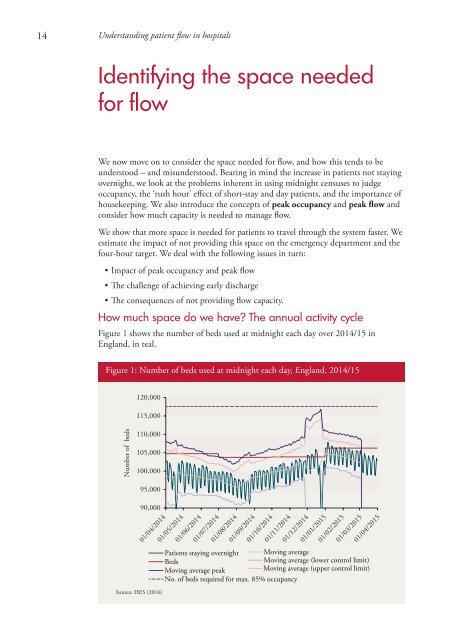
Figure 1 shows the number of beds used at midnight each day over 2014/15 <strong>in</strong><br />
England, <strong>in</strong> teal.<br />
Figure 1: Number of beds used at midnight each day, England, 2014/15<br />
120,000<br />
115,000<br />
Number of beds<br />
110,000<br />
105,000<br />
100,000<br />
95,000<br />
90,000<br />
01/04/2014<br />
Source: HES (2016)<br />
01/05/2014<br />
01/06/2014<br />
01/07/2014<br />
01/08/2014<br />
01/09/2014<br />
01/10/2014<br />
01/11/2014<br />
01/12/2014<br />
01/01/2015<br />
01/02/2015<br />
01/03/2015<br />
01/04/2015<br />
Patients stay<strong>in</strong>g overnight Mov<strong>in</strong>g average<br />
Beds<br />
Mov<strong>in</strong>g average (lower control limit)<br />
Mov<strong>in</strong>g average peak<br />
Mov<strong>in</strong>g average (upper control limit)<br />
No. of beds required for max. 85% occupancy