Understanding patient flow in hospitals
understanding_patient_flow_in_hospitals_web_0
understanding_patient_flow_in_hospitals_web_0

Create successful ePaper yourself
Turn your PDF publications into a flip-book with our unique Google optimized e-Paper software.
18 <strong>Understand<strong>in</strong>g</strong> <strong>patient</strong> <strong>flow</strong> <strong>in</strong> <strong>hospitals</strong><br />
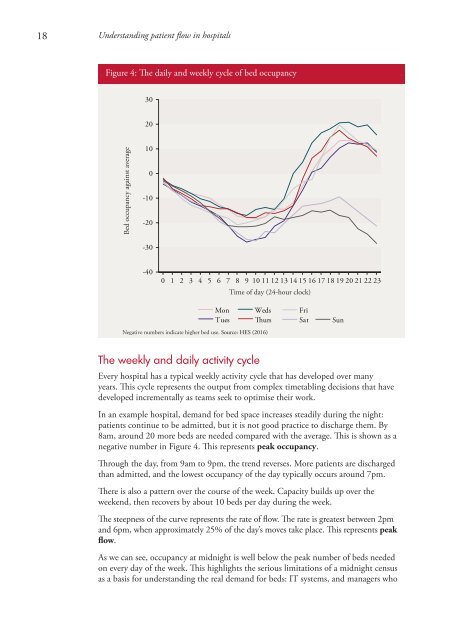
Figure 4: The daily and weekly cycle of bed occupancy<br />
30<br />
20<br />
Bed occupancy aga<strong>in</strong>st average<br />
10<br />
0<br />
-10<br />
-20<br />
-30<br />
-40<br />
0 1 2 3 4 5 6 7 8 9 10 11 12 13 14 15 16 17 18 19 20 21 22 23<br />
Time of day (24-hour clock)<br />
Mon<br />
Tues<br />
Weds<br />
Thurs<br />
Negative numbers <strong>in</strong>dicate higher bed use. Source: HES (2016)<br />
Fri<br />
Sat<br />
Sun<br />
The weekly and daily activity cycle<br />
Every hospital has a typical weekly activity cycle that has developed over many<br />
years. This cycle represents the output from complex timetabl<strong>in</strong>g decisions that have<br />
developed <strong>in</strong>crementally as teams seek to optimise their work.<br />
In an example hospital, demand for bed space <strong>in</strong>creases steadily dur<strong>in</strong>g the night:<br />
<strong>patient</strong>s cont<strong>in</strong>ue to be admitted, but it is not good practice to discharge them. By<br />
8am, around 20 more beds are needed compared with the average. This is shown as a<br />
negative number <strong>in</strong> Figure 4. This represents peak occupancy.<br />
Through the day, from 9am to 9pm, the trend reverses. More <strong>patient</strong>s are discharged<br />
than admitted, and the lowest occupancy of the day typically occurs around 7pm.<br />
There is also a pattern over the course of the week. Capacity builds up over the<br />
weekend, then recovers by about 10 beds per day dur<strong>in</strong>g the week.<br />
The steepness of the curve represents the rate of <strong>flow</strong>. The rate is greatest between 2pm<br />
and 6pm, when approximately 25% of the day’s moves take place. This represents peak<br />
<strong>flow</strong>.<br />
As we can see, occupancy at midnight is well below the peak number of beds needed<br />
on every day of the week. This highlights the serious limitations of a midnight census<br />
as a basis for understand<strong>in</strong>g the real demand for beds: IT systems, and managers who