Understanding patient flow in hospitals
understanding_patient_flow_in_hospitals_web_0
understanding_patient_flow_in_hospitals_web_0

Create successful ePaper yourself
Turn your PDF publications into a flip-book with our unique Google optimized e-Paper software.
16 <strong>Understand<strong>in</strong>g</strong> <strong>patient</strong> <strong>flow</strong> <strong>in</strong> <strong>hospitals</strong><br />
The number of <strong>patient</strong>s stay<strong>in</strong>g overnight, which is measured at midnight, is how<br />
<strong>hospitals</strong> measure occupancy. Measured occupancy, shown <strong>in</strong> teal <strong>in</strong> the figure, only<br />
actually exceeds the number of beds at a few po<strong>in</strong>ts <strong>in</strong> the year. However, the upper<br />
control limit level, show<strong>in</strong>g the level of occupancy on the 2.5% of days with most bed use,<br />
is often above this level. This <strong>in</strong>dicates a high level of risk with m<strong>in</strong>imal system resilience.<br />
As the system becomes saturated <strong>in</strong> w<strong>in</strong>ter, variation reduces <strong>in</strong> bed use from day to<br />
day. This is because the maximum number of beds cannot be exceeded. A ‘one <strong>in</strong>, one<br />
out’ dynamic takes hold as <strong>patient</strong>s queue for the next available bed, which is filled<br />
very quickly.<br />
Track<strong>in</strong>g the level of variation may provide an early warn<strong>in</strong>g of system performance. As<br />
a benchmark, the <strong>hospitals</strong> achiev<strong>in</strong>g the four-hour standard had a standard deviation<br />
of around 5% of average beds used. In theory, larger <strong>hospitals</strong> should be able to manage<br />
with less variation, but they will need more <strong>flow</strong> capacity ow<strong>in</strong>g to the <strong>in</strong>creased volume<br />
of <strong>patient</strong>s be<strong>in</strong>g treated. This is expla<strong>in</strong>ed <strong>in</strong> more detail <strong>in</strong> the next section.<br />
The mov<strong>in</strong>g average peak l<strong>in</strong>e, shown <strong>in</strong> dark purple, shows the capacity needed based<br />
on peak occupancy compared with calculations based on the midnight census.<br />
Admission rates<br />
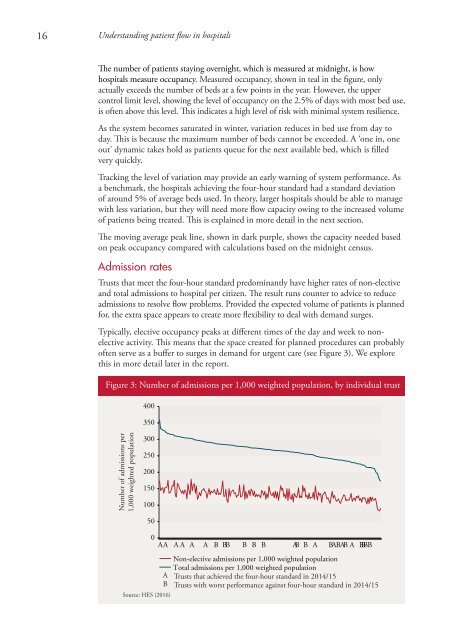
Trusts that meet the four-hour standard predom<strong>in</strong>antly have higher rates of non-elective<br />
and total admissions to hospital per citizen. The result runs counter to advice to reduce<br />
admissions to resolve <strong>flow</strong> problems. Provided the expected volume of <strong>patient</strong>s is planned<br />
for, the extra space appears to create more flexibility to deal with demand surges.<br />
Typically, elective occupancy peaks at different times of the day and week to nonelective<br />
activity. This means that the space created for planned procedures can probably<br />
often serve as a buffer to surges <strong>in</strong> demand for urgent care (see Figure 3). We explore<br />
this <strong>in</strong> more detail later <strong>in</strong> the report.<br />
Figure 3: Number of admissions per 1,000 weighted population, by <strong>in</strong>dividual trust<br />
400<br />
350<br />
Number of admissions per<br />
1,000 weighted population<br />
300<br />
250<br />
200<br />
150<br />
100<br />
50<br />
Source: HES (2016)<br />
0<br />
AA AA A A B BB B B B AB B A BABAB A BBBB<br />
Non-elective admissions per 1,000 weighted population<br />
Total admissions per 1,000 weighted population<br />
A Trusts that achieved the four-hour standard <strong>in</strong> 2014/15<br />
B Trusts with worst performance aga<strong>in</strong>st four-hour standard <strong>in</strong> 2014/15