Understanding patient flow in hospitals
understanding_patient_flow_in_hospitals_web_0
understanding_patient_flow_in_hospitals_web_0

You also want an ePaper? Increase the reach of your titles
YUMPU automatically turns print PDFs into web optimized ePapers that Google loves.
30 <strong>Understand<strong>in</strong>g</strong> <strong>patient</strong> <strong>flow</strong> <strong>in</strong> <strong>hospitals</strong><br />
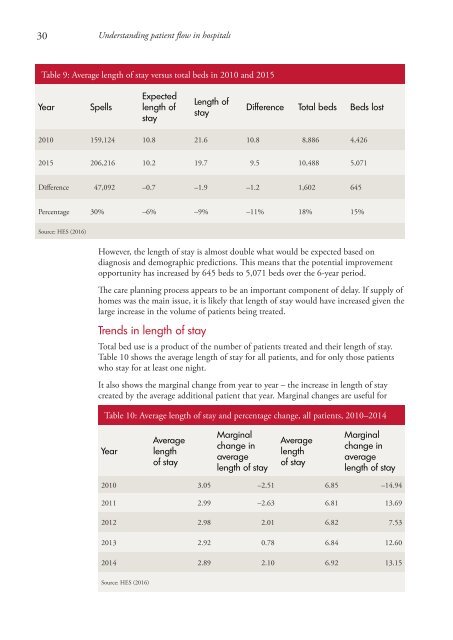
Table 9: Average length of stay versus total beds <strong>in</strong> 2010 and 2015<br />
Year<br />
Spells<br />
Expected<br />
length of<br />
stay<br />
Length of<br />
stay<br />
Difference Total beds Beds lost<br />
2010 159,124 10.8 21.6 10.8 8,886 4,426<br />
2015 206,216 10.2 19.7 9.5 10,488 5,071<br />
Difference 47,092 –0.7 –1.9 –1.2 1,602 645<br />
Percentage 30% –6% –9% –11% 18% 15%<br />
Source: HES (2016)<br />
However, the length of stay is almost double what would be expected based on<br />
diagnosis and demographic predictions. This means that the potential improvement<br />
opportunity has <strong>in</strong>creased by 645 beds to 5,071 beds over the 6-year period.<br />
The care plann<strong>in</strong>g process appears to be an important component of delay. If supply of<br />
homes was the ma<strong>in</strong> issue, it is likely that length of stay would have <strong>in</strong>creased given the<br />
large <strong>in</strong>crease <strong>in</strong> the volume of <strong>patient</strong>s be<strong>in</strong>g treated.<br />
Trends <strong>in</strong> length of stay<br />
Total bed use is a product of the number of <strong>patient</strong>s treated and their length of stay.<br />
Table 10 shows the average length of stay for all <strong>patient</strong>s, and for only those <strong>patient</strong>s<br />
who stay for at least one night.<br />
It also shows the marg<strong>in</strong>al change from year to year – the <strong>in</strong>crease <strong>in</strong> length of stay<br />
created by the average additional <strong>patient</strong> that year. Marg<strong>in</strong>al changes are useful for<br />
Table 10: Average length of stay and percentage change, all <strong>patient</strong>s, 2010–2014<br />
Year<br />
Average<br />
length<br />
of stay<br />
Marg<strong>in</strong>al<br />
change <strong>in</strong><br />
average<br />
length of stay<br />
Average<br />
length<br />
of stay<br />
Marg<strong>in</strong>al<br />
change <strong>in</strong><br />
average<br />
length of stay<br />
2010 3.05 –2.51 6.85 –14.94<br />
2011 2.99 –2.63 6.81 13.69<br />
2012 2.98 2.01 6.82 7.53<br />
2013 2.92 0.78 6.84 12.60<br />
2014 2.89 2.10 6.92 13.15<br />
Source: HES (2016)