Understanding patient flow in hospitals
understanding_patient_flow_in_hospitals_web_0
understanding_patient_flow_in_hospitals_web_0

Create successful ePaper yourself
Turn your PDF publications into a flip-book with our unique Google optimized e-Paper software.
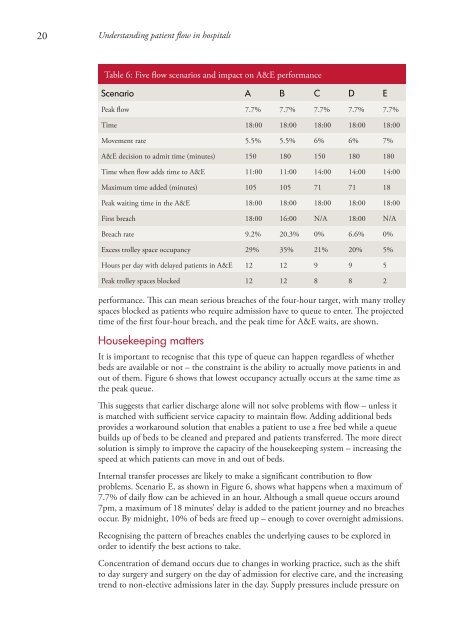
20 <strong>Understand<strong>in</strong>g</strong> <strong>patient</strong> <strong>flow</strong> <strong>in</strong> <strong>hospitals</strong><br />
Table 6: Five <strong>flow</strong> scenarios and impact on A&E performance<br />
Scenario A B C D E<br />
Peak <strong>flow</strong> 7.7% 7.7% 7.7% 7.7% 7.7%<br />
Time 18:00 18:00 18:00 18:00 18:00<br />
Movement rate 5.5% 5.5% 6% 6% 7%<br />
A&E decision to admit time (m<strong>in</strong>utes) 150 180 150 180 180<br />
Time when <strong>flow</strong> adds time to A&E 11:00 11:00 14:00 14:00 14:00<br />
Maximum time added (m<strong>in</strong>utes) 105 105 71 71 18<br />
Peak wait<strong>in</strong>g time <strong>in</strong> the A&E 18:00 18:00 18:00 18:00 18:00<br />
First breach 18:00 16:00 N/A 18:00 N/A<br />
Breach rate 9.2% 20.3% 0% 6.6% 0%<br />
Excess trolley space occupancy 29% 35% 21% 20% 5%<br />
Hours per day with delayed <strong>patient</strong>s <strong>in</strong> A&E 12 12 9 9 5<br />
Peak trolley spaces blocked 12 12 8 8 2<br />
performance. This can mean serious breaches of the four-hour target, with many trolley<br />
spaces blocked as <strong>patient</strong>s who require admission have to queue to enter. The projected<br />
time of the first four-hour breach, and the peak time for A&E waits, are shown.<br />
Housekeep<strong>in</strong>g matters<br />
It is important to recognise that this type of queue can happen regardless of whether<br />
beds are available or not – the constra<strong>in</strong>t is the ability to actually move <strong>patient</strong>s <strong>in</strong> and<br />
out of them. Figure 6 shows that lowest occupancy actually occurs at the same time as<br />
the peak queue.<br />
This suggests that earlier discharge alone will not solve problems with <strong>flow</strong> – unless it<br />
is matched with sufficient service capacity to ma<strong>in</strong>ta<strong>in</strong> <strong>flow</strong>. Add<strong>in</strong>g additional beds<br />
provides a workaround solution that enables a <strong>patient</strong> to use a free bed while a queue<br />
builds up of beds to be cleaned and prepared and <strong>patient</strong>s transferred. The more direct<br />
solution is simply to improve the capacity of the housekeep<strong>in</strong>g system – <strong>in</strong>creas<strong>in</strong>g the<br />
speed at which <strong>patient</strong>s can move <strong>in</strong> and out of beds.<br />
Internal transfer processes are likely to make a significant contribution to <strong>flow</strong><br />
problems. Scenario E, as shown <strong>in</strong> Figure 6, shows what happens when a maximum of<br />
7.7% of daily <strong>flow</strong> can be achieved <strong>in</strong> an hour. Although a small queue occurs around<br />
7pm, a maximum of 18 m<strong>in</strong>utes’ delay is added to the <strong>patient</strong> journey and no breaches<br />
occur. By midnight, 10% of beds are freed up – enough to cover overnight admissions.<br />
Recognis<strong>in</strong>g the pattern of breaches enables the underly<strong>in</strong>g causes to be explored <strong>in</strong><br />
order to identify the best actions to take.<br />
Concentration of demand occurs due to changes <strong>in</strong> work<strong>in</strong>g practice, such as the shift<br />
to day surgery and surgery on the day of admission for elective care, and the <strong>in</strong>creas<strong>in</strong>g<br />
trend to non-elective admissions later <strong>in</strong> the day. Supply pressures <strong>in</strong>clude pressure on