Understanding patient flow in hospitals
understanding_patient_flow_in_hospitals_web_0
understanding_patient_flow_in_hospitals_web_0

You also want an ePaper? Increase the reach of your titles
YUMPU automatically turns print PDFs into web optimized ePapers that Google loves.
28 <strong>Understand<strong>in</strong>g</strong> <strong>patient</strong> <strong>flow</strong> <strong>in</strong> <strong>hospitals</strong><br />
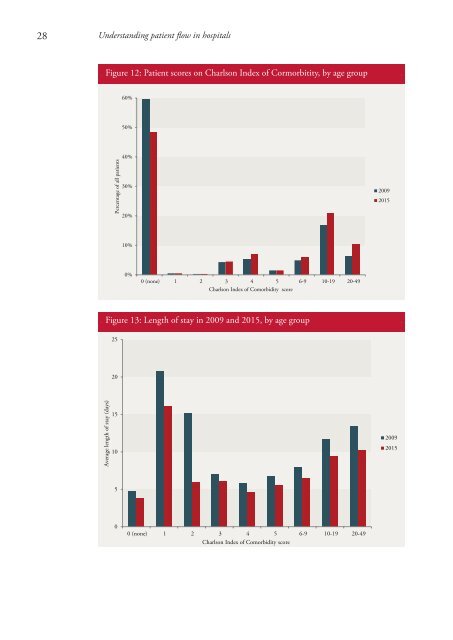
Figure 12: Patient scores on Charlson Index of Cormorbitity, by age group<br />
60%<br />
50%<br />
Percentage of all <strong>patient</strong>s<br />
40%<br />
30%<br />
20%<br />
2009<br />
2015<br />
10%<br />
0%<br />
0 (none) 1 2 3 4 5 6-9 10-19 20-49<br />
Charlson Index of Comorbidity score<br />
Figure 13: Length of stay <strong>in</strong> 2009 and 2015, by age group<br />
25<br />
20<br />
Average length of stay (days)<br />
15<br />
10<br />
2009<br />
2015<br />
5<br />
0<br />
0 (none) 1 2 3 4 5 6-9 10-19 20-49<br />
Charlson Index of Comorbidity score