Understanding patient flow in hospitals
understanding_patient_flow_in_hospitals_web_0
understanding_patient_flow_in_hospitals_web_0

Create successful ePaper yourself
Turn your PDF publications into a flip-book with our unique Google optimized e-Paper software.
24 <strong>Understand<strong>in</strong>g</strong> <strong>patient</strong> <strong>flow</strong> <strong>in</strong> <strong>hospitals</strong><br />
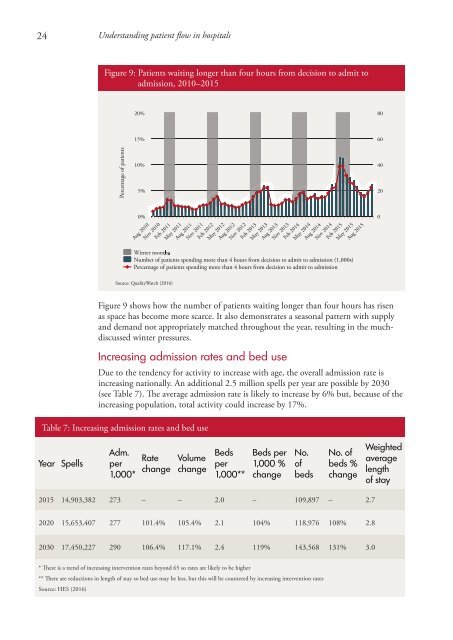
Figure 9: Patients wait<strong>in</strong>g longer than four hours from decision to admit to<br />
admission, 2010–2015<br />
20%<br />
80<br />
Percentage of <strong>patient</strong>s<br />
15%<br />
10%<br />
Figure 9 shows how the number of <strong>patient</strong>s wait<strong>in</strong>g longer than four hours has risen<br />
as space has become more scarce. It also demonstrates a seasonal pattern with supply<br />
and demand not appropriately matched throughout the year, result<strong>in</strong>g <strong>in</strong> the muchdiscussed<br />
w<strong>in</strong>ter pressures.<br />
Increas<strong>in</strong>g admission rates and bed use<br />
Due to the tendency for activity to <strong>in</strong>crease with age, the overall admission rate is<br />
<strong>in</strong>creas<strong>in</strong>g nationally. An additional 2.5 million spells per year are possible by 2030<br />
(see Table 7). The average admission rate is likely to <strong>in</strong>crease by 6% but, because of the<br />
<strong>in</strong>creas<strong>in</strong>g population, total activity could <strong>in</strong>crease by 17%.<br />
Table 7: Increas<strong>in</strong>g admission rates and bed use<br />
5%<br />
0%<br />
Aug 2010<br />
Nov 2010<br />
W<strong>in</strong>ter months<br />
Number of <strong>patient</strong>s spend<strong>in</strong>g more than 4 hours from decision to admit to admission (1,000s)<br />
Percentage of <strong>patient</strong>s spend<strong>in</strong>g more than 4 hours from decision to admit to admission<br />
Source: QualityWatch (2016)<br />
Feb 2011<br />
May 2011<br />
Aug 2011<br />
Nov 2011<br />
Feb 2012<br />
May 2012<br />
Aug 2012<br />
Nov 2012<br />
Feb 2013<br />
May 2013<br />
Aug 2013<br />
Nov 2013<br />
Feb 2014<br />
May 2014<br />
Aug 2014<br />
Nov 2014<br />
Feb 2015<br />
May 2015<br />
Aug 2015<br />
60<br />
40<br />
20<br />
0<br />
Number of <strong>patient</strong>s (1,000s)<br />
Year Spells<br />
Adm.<br />
per<br />
1,000*<br />
Rate<br />
change<br />
Volume<br />
change<br />
Beds<br />
per<br />
1,000**<br />
Beds per<br />
1,000 %<br />
change<br />
No.<br />
of<br />
beds<br />
No. of<br />
beds %<br />
change<br />
Weighted<br />
average<br />
length<br />
of stay<br />
2015 14,903,382 273 – – 2.0 – 109,897 – 2.7<br />
2020 15,653,407 277 101.4% 105.4% 2.1 104% 118,976 108% 2.8<br />
2030 17,450,227 290 106.4% 117.1% 2.4 119% 143,568 131% 3.0<br />
* There is a trend of <strong>in</strong>creas<strong>in</strong>g <strong>in</strong>tervention rates beyond 65 so rates are likely to be higher<br />
** There are reductions <strong>in</strong> length of stay so bed use may be less, but this will be countered by <strong>in</strong>creas<strong>in</strong>g <strong>in</strong>tervention rates<br />
Source: HES (2016)