Leaving no one behind the imperative of inclusive development
full-report
full-report

You also want an ePaper? Increase the reach of your titles
YUMPU automatically turns print PDFs into web optimized ePapers that Google loves.
100<br />
<strong>Leaving</strong> <strong>no</strong> <strong>one</strong> <strong>behind</strong><br />
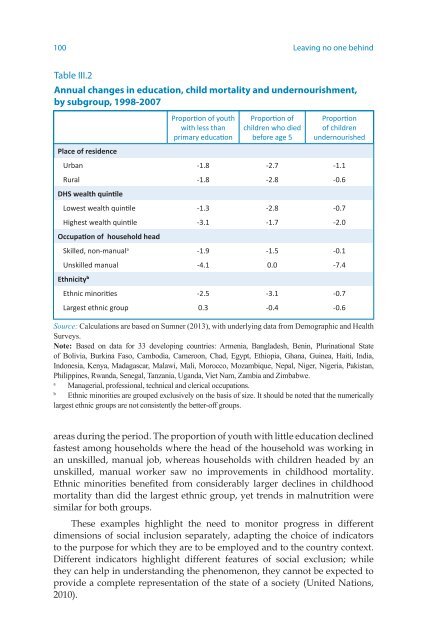
Table III.2<br />
Annual changes in education, child mortality and under<strong>no</strong>urishment,<br />
by subgroup, 1998-2007<br />
Place <strong>of</strong> residence<br />
Proportion <strong>of</strong> youth<br />
with less than<br />
primary education<br />
Proportion <strong>of</strong><br />
children who died<br />
before age 5<br />
Proportion<br />
<strong>of</strong> children<br />
under<strong>no</strong>urished<br />
Urban -1.8 -2.7 -1.1<br />
Rural -1.8 -2.8 -0.6<br />
DHS wealth quintile<br />
Lowest wealth quintile -1.3 -2.8 -0.7<br />
Highest wealth quintile -3.1 -1.7 -2.0<br />
Occupation <strong>of</strong> household head<br />
Skilled, <strong>no</strong>n-manual a -1.9 -1.5 -0.1<br />
Unskilled manual -4.1 0.0 -7.4<br />
Ethnicityb<br />
Ethnic mi<strong>no</strong>rities -2.5 -3.1 -0.7<br />
Largest ethnic group 0.3 -0.4 -0.6<br />
Source: Calculations are based on Sumner (2013), with underlying data from Demographic and Health<br />
Surveys.<br />
Note: Based on data for 33 developing countries: Armenia, Bangladesh, Benin, Plurinational State<br />
<strong>of</strong> Bolivia, Burkina Faso, Cambodia, Cameroon, Chad, Egypt, Ethiopia, Ghana, Guinea, Haiti, India,<br />
Ind<strong>one</strong>sia, Kenya, Madagascar, Malawi, Mali, Morocco, Mozambique, Nepal, Niger, Nigeria, Pakistan,<br />
Philippines, Rwanda, Senegal, Tanzania, Uganda, Viet Nam, Zambia and Zimbabwe.<br />
a<br />
Managerial, pr<strong>of</strong>essional, technical and clerical occupations.<br />
b<br />
Ethnic mi<strong>no</strong>rities are grouped exclusively on <strong>the</strong> basis <strong>of</strong> size. It should be <strong>no</strong>ted that <strong>the</strong> numerically<br />
largest ethnic groups are <strong>no</strong>t consistently <strong>the</strong> better-<strong>of</strong>f groups.<br />
areas during <strong>the</strong> period. The proportion <strong>of</strong> youth with little education declined<br />
fastest among households where <strong>the</strong> head <strong>of</strong> <strong>the</strong> household was working in<br />
an unskilled, manual job, whereas households with children headed by an<br />
unskilled, manual worker saw <strong>no</strong> improvements in childhood mortality.<br />
Ethnic mi<strong>no</strong>rities benefited from considerably larger declines in childhood<br />
mortality than did <strong>the</strong> largest ethnic group, yet trends in malnutrition were<br />
similar for both groups.<br />
These examples highlight <strong>the</strong> need to monitor progress in different<br />
dimensions <strong>of</strong> social inclusion separately, adapting <strong>the</strong> choice <strong>of</strong> indicators<br />
to <strong>the</strong> purpose for which <strong>the</strong>y are to be employed and to <strong>the</strong> country context.<br />
Different indicators highlight different features <strong>of</strong> social exclusion; while<br />
<strong>the</strong>y can help in understanding <strong>the</strong> phe<strong>no</strong>me<strong>no</strong>n, <strong>the</strong>y can<strong>no</strong>t be expected to<br />
provide a complete representation <strong>of</strong> <strong>the</strong> state <strong>of</strong> a society (United Nations,<br />
2010).