Leaving no one behind the imperative of inclusive development
full-report
full-report

You also want an ePaper? Increase the reach of your titles
YUMPU automatically turns print PDFs into web optimized ePapers that Google loves.
68<br />
<strong>Leaving</strong> <strong>no</strong> <strong>one</strong> <strong>behind</strong><br />
an outcome <strong>of</strong> <strong>the</strong> Government’s efforts to promote inclusion (Ministerio de<br />
Energía y Minas, República del Perú, 2011).<br />
Regarding access to ICTs, in recent years rapid tech<strong>no</strong>logical in<strong>no</strong>vation<br />
has allowed for a significant expansion <strong>of</strong> broadband connections and growth<br />
in <strong>the</strong> use <strong>of</strong> mobile communications to do business, create new livelihoods,<br />
improve productivity and promote <strong>development</strong>. It is estimated that <strong>the</strong><br />
number <strong>of</strong> mobile ph<strong>one</strong> owners <strong>no</strong>w surpasses <strong>the</strong> number <strong>of</strong> those who<br />
have access to electricity or clean water (World Bank, 2016). Growing access<br />
to ICTs has also been crucial in enabling participation, giving individuals and<br />
groups <strong>the</strong> ability to voice <strong>the</strong>ir opinions and helping <strong>the</strong>m organize around<br />
common causes and across geographical boundaries. The potential <strong>of</strong> ICTs is<br />
particularly broad for youth, who are already using social media in significant<br />
numbers to connect, share and inspire o<strong>the</strong>rs.<br />
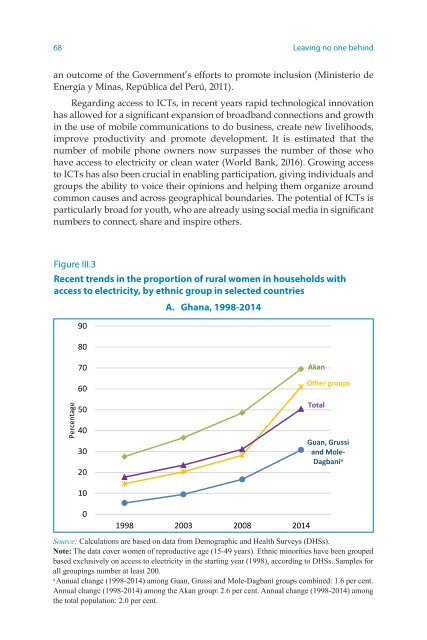
Figure III.3<br />
Recent trends in <strong>the</strong> proportion <strong>of</strong> rural women in households with<br />
access to electricity, by ethnic group in selected countries<br />
90<br />
80<br />
A. Ghana, 1998-2014<br />
Percentage<br />
70<br />
60<br />
50<br />
40<br />
30<br />
20<br />
10<br />
0<br />
1998 2003 2008 2014<br />
Akan<br />
O<strong>the</strong>r groups<br />
Total<br />
Guan, Grussi<br />
and Mole-<br />
Dagbani a<br />
Source: Calculations are based on data from Demographic and Health Surveys (DHSs).<br />
Note: The data cover women <strong>of</strong> reproductive age (15-49 years). Ethnic mi<strong>no</strong>rities have been grouped<br />
based exclusively on access to electricity in <strong>the</strong> starting year (1998), according to DHSs. Samples for<br />
all groupings number at least 200.<br />
a<br />
Annual change (1998-2014) among Guan, Grussi and Mole-Dagbani groups combined: 1.6 per cent.<br />
Annual change (1998-2014) among <strong>the</strong> Akan group: 2.6 per cent. Annual change (1998-2014) among<br />
<strong>the</strong> total population: 2.0 per cent.