Leaving no one behind the imperative of inclusive development
full-report
full-report

You also want an ePaper? Increase the reach of your titles
YUMPU automatically turns print PDFs into web optimized ePapers that Google loves.
66<br />
<strong>Leaving</strong> <strong>no</strong> <strong>one</strong> <strong>behind</strong><br />
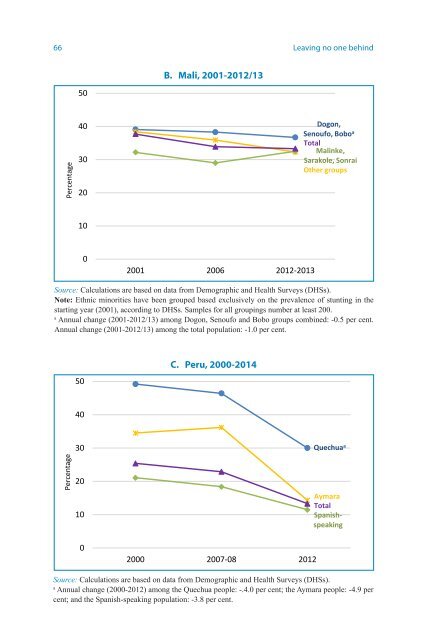
B. Mali, 2001-2012/13<br />
50<br />
Percentage<br />
40<br />
30<br />
20<br />
Dogon,<br />
Se<strong>no</strong>ufo, Bobo a<br />
Total<br />
Malinke,<br />
Sarakole, Sonrai<br />
O<strong>the</strong>r groups<br />
10<br />
0<br />
2001 2006 2012-2013<br />
Source: Calculations are based on data from Demographic and Health Surveys (DHSs).<br />
Note: Ethnic mi<strong>no</strong>rities have been grouped based exclusively on <strong>the</strong> prevalence <strong>of</strong> stunting in <strong>the</strong><br />
starting year (2001), according to DHSs. Samples for all groupings number at least 200.<br />
a<br />
Annual change (2001-2012/13) among Dogon, Se<strong>no</strong>ufo and Bobo groups combined: -0.5 per cent.<br />
Annual change (2001-2012/13) among <strong>the</strong> total population: -1.0 per cent.<br />
50<br />
C. Peru, 2000-2014<br />
40<br />
Percentage<br />
30<br />
20<br />
10<br />
Quechua a<br />
Aymara<br />
Total<br />
Spanishspeaking<br />
0<br />
2000 2007-08 2012<br />
Source: Calculations are based on data from Demographic and Health Surveys (DHSs).<br />
a<br />
Annual change (2000-2012) among <strong>the</strong> Quechua people: -.4.0 per cent; <strong>the</strong> Aymara people: -4.9 per<br />
cent; and <strong>the</strong> Spanish-speaking population: -3.8 per cent.