Leaving no one behind the imperative of inclusive development
full-report
full-report

Create successful ePaper yourself
Turn your PDF publications into a flip-book with our unique Google optimized e-Paper software.
Prejudice and discrimination 113<br />
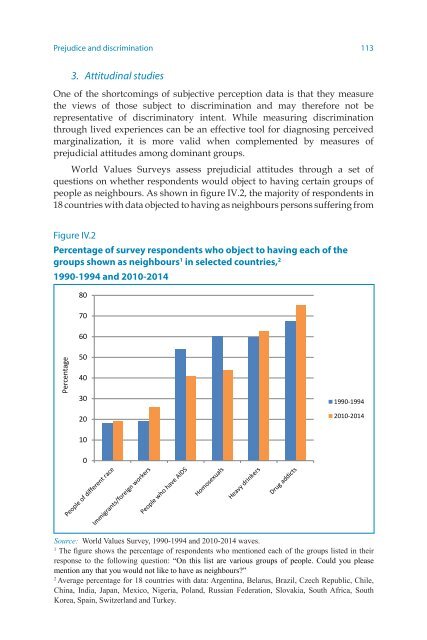
3. Attitudinal studies<br />
One <strong>of</strong> <strong>the</strong> shortcomings <strong>of</strong> subjective perception data is that <strong>the</strong>y measure<br />
<strong>the</strong> views <strong>of</strong> those subject to discrimination and may <strong>the</strong>refore <strong>no</strong>t be<br />
representative <strong>of</strong> discriminatory intent. While measuring discrimination<br />
through lived experiences can be an effective tool for diag<strong>no</strong>sing perceived<br />
marginalization, it is more valid when complemented by measures <strong>of</strong><br />
prejudicial attitudes among dominant groups.<br />
World Values Surveys assess prejudicial attitudes through a set <strong>of</strong><br />
questions on whe<strong>the</strong>r respondents would object to having certain groups <strong>of</strong><br />
people as neighbours. As shown in figure IV.2, <strong>the</strong> majority <strong>of</strong> respondents in<br />
18 countries with data objected to having as neighbours persons suffering from<br />
Figure IV.2<br />
Percentage <strong>of</strong> survey respondents who object to having each <strong>of</strong> <strong>the</strong><br />
groups shown as neighbours 1 in selected countries, 2<br />
1990-1994 and 2010-2014<br />
80<br />
70<br />
60<br />
Percentage<br />
50<br />
40<br />
30<br />
20<br />
1990-1994<br />
2010-2014<br />
10<br />
0<br />
Source: World Values Survey, 1990-1994 and 2010-2014 waves.<br />
1<br />
The figure shows <strong>the</strong> percentage <strong>of</strong> respondents who menti<strong>one</strong>d each <strong>of</strong> <strong>the</strong> groups listed in <strong>the</strong>ir<br />
response to <strong>the</strong> following question: “On this list are various groups <strong>of</strong> people. Could you please<br />
mention any that you would <strong>no</strong>t like to have as neighbours?”<br />
2<br />
Average percentage for 18 countries with data: Argentina, Belarus, Brazil, Czech Republic, Chile,<br />
China, India, Japan, Mexico, Nigeria, Poland, Russian Federation, Slovakia, South Africa, South<br />
Korea, Spain, Switzerland and Turkey.