- Page 2:
This page was added on 11 January 2
- Page 5 and 6:
ISSN 0312-4746 © Commonwealth of A
- Page 7 and 8:
4 5 6 Water management Water availa
- Page 9 and 10:
10 11 12 13 Families 300 Children 3
- Page 11 and 12:
17 18 19 20 21 22 Forestry and fish
- Page 13 and 14:
27 28 29 30 31 Financial system 667
- Page 16:
Preface Year Book Australia is the
- Page 19 and 20:
As well as the information included
- Page 21 and 22:
MB MBS Mc MHA ML MLA Mm³ MP Mt n.e
- Page 23 and 24:
that sustain humans, such as food,
- Page 25 and 26:
Zebra Finch. for its richness in en
- Page 27 and 28:
Diversity of Australian landscapes
- Page 29 and 30:
3. BIOREGIONS OF AUSTRALIA, Interim
- Page 31 and 32:
Inland aquatic ecosystems Aquatic b
- Page 33 and 34:
Frogs as indicators of aquatic ecos
- Page 35 and 36:
The cost in monetary terms of intro
- Page 37 and 38:
Moreover, they can change the speci
- Page 39 and 40:
10. INCREASE IN AREA OF COMMONWEALT
- Page 41 and 42:
Around 77 per cent of the Australia
- Page 43 and 44:
End notes 1. For further informatio
- Page 45 and 46:
Threatened Species, Commonwealth of
- Page 47 and 48:
• a sense of belonging for everyo
- Page 49 and 50:
Strengthening Australia’s social
- Page 51 and 52:
Australians in a distant age that s
- Page 53 and 54:
language, the AUSTKIN project is de
- Page 55 and 56:
3. STRONG INDIGENOUS LANGUAGES Tiwi
- Page 57 and 58:
of research contribute not only to
- Page 59 and 60:
of their interest in Indigenous cul
- Page 61 and 62:
etween Indigenous organisations inv
- Page 63 and 64:
Girl Guides - leading the way for A
- Page 65 and 66:
1910 Girl Guides begins In May of t
- Page 67 and 68:
A program, the Olave Program, speci
- Page 69 and 70:
that ‘girls should be at the cent
- Page 71 and 72:
Power Up Also in January 2010, 100
- Page 73 and 74:
participate in global centenary eve
- Page 75 and 76:
Geography of Australia Position and
- Page 77 and 78:
1.4 ELEVATION Source: Australian Su
- Page 79 and 80:
ago. A more significant impact of g
- Page 81 and 82:
The sub-tropical ridge consists of
- Page 83 and 84:
Interannual and interdecadal variab
- Page 85 and 86:
Rainfall and other precipitation An
- Page 87 and 88:
• the wet summer and relatively (
- Page 89 and 90:
1.10 AUSTRALIAN RAINFALL DECILES -
- Page 91 and 92:
Snowfalls at lower elevations are m
- Page 93 and 94:
Temperature Average temperatures Av
- Page 95 and 96:
1.13 AVERAGE MINIMUM TEMPERATURE (a
- Page 97 and 98:
1.15 EXTREME MAXIMUM TEMPERATURES S
- Page 99 and 100:
Evaporation Average annual pan evap
- Page 101 and 102:
Bibliography ABS products Australia
- Page 104 and 105:
2 ENVIRONMENT As well as providing
- Page 106 and 107:
% of persons 20 15 2.3 PUBLIC TRANS
- Page 108 and 109:
% 100 2.6 WHETHER CONCERNED ABOUT A
- Page 110 and 111:
% 80 2.10 PERSONAL GROSS WEEKLY INC
- Page 112 and 113:
% 100 2.15 HEATERS IN DWELLINGS 80
- Page 114 and 115:
Household water use and conservatio
- Page 116 and 117:
ely on rainwater tanks, bores or we
- Page 118 and 119:
2.27 WASTE ITEMS RECYCLED/REUSED BY
- Page 120 and 121:
% 50 40 2.31 AWARENESS OF HOUSEHOLD
- Page 122 and 123:
2.34 ENVIRONMENTAL ASSETS, Volume/R
- Page 124 and 125:
$2b compared with $385b for subsoil
- Page 126 and 127:
Households and renewable energy Whi
- Page 128 and 129:
% 60 2.41 WOOD, USE IN DWELLINGS 20
- Page 130:
Bibliography ABS products Australia
- Page 133 and 134:
Land and biodiversity Biodiversity
- Page 135 and 136:
3.4 TERRESTRIAL PROTECTED AREAS, AU
- Page 137 and 138:
Category Diseases, fungi, and paras
- Page 139 and 140:
3.9 RAINFALL ANOMALIES—1 SEPTEMBE
- Page 141 and 142:
3.12 TOTAL STORAGE LEVEL OF LARGE D
- Page 143 and 144:
Murray-Darling Basin The Murray-Dar
- Page 145 and 146:
3.20 WATER CONSUMPTION IN THE MURRA
- Page 147 and 148:
3.23 WATER STORAGE (a), Murray-Darl
- Page 149 and 150:
Although the Australian economy (GD
- Page 151 and 152:
3.28 SELECTED AIR POLLUTANTS AND SO
- Page 153 and 154:
Bibliography ABS products Australia
- Page 155 and 156:
Constitutional basis of government
- Page 157 and 158:
The representation of the people is
- Page 159 and 160:
Prime Minister 4.2 FIRST RUDD MINIS
- Page 161 and 162:
2007 election The House of Represen
- Page 163 and 164:
electorate of Lingiari (Northern Te
- Page 165 and 166:
Bibliography References Bach S 2003
- Page 168 and 169:
5 INTERNATIONAL RELATIONS This chap
- Page 170 and 171:
cooperation, including in addressin
- Page 172 and 173:
China of contemporary Australia’s
- Page 174 and 175:
Foreign Ministers Framework Dialogu
- Page 176 and 177:
opportunities to urge the Burmese r
- Page 178 and 179:
Bilateral relations with other Euro
- Page 180 and 181:
Australia's security interests Aust
- Page 182 and 183:
using all opportunities of engageme
- Page 184 and 185:
Australia is currently negotiating
- Page 186 and 187:
Australia and the Commonwealth Aust
- Page 188 and 189:
5.2 LOCATION OF AUSTRALIA-BASED DFA
- Page 190 and 191:
of falling into extreme poverty and
- Page 192 and 193:
years, Australia will provide 20,00
- Page 194 and 195:
per 100,000 live births, one of the
- Page 196 and 197:
Country and regional programs Detai
- Page 198 and 199:
Multilateral engagement Australia w
- Page 200 and 201:
6 DEFENCE This chapter was contribu
- Page 202 and 203:
Operation Kruger Commencing in 2009
- Page 204 and 205:
• 2.2 per cent average real growt
- Page 206 and 207:
• 57 Pilatus PC-9 training aircra
- Page 208 and 209:
groups on issues pertaining to the
- Page 210 and 211:
7 POPULATION Population statistics
- Page 212 and 213: 7.3 POPULATION, By state and territ
- Page 214 and 215: 7.6 AGE DISTRIBUTION OF POPULATION
- Page 216 and 217: Series A Series B Series C 7.10 PRO
- Page 218 and 219: '000 600 400 7.12 AGE STRUCTURE OF
- Page 220 and 221: and the neighbouring Sydney (C) - W
- Page 222 and 223: 7.16 COMPONENTS OF POPULATION GROWT
- Page 224 and 225: 7.19 AGE DISTRIBUTION OF THE INDIGE
- Page 226 and 227: 7.21 TOTAL FERTILITY RATES(a), Sele
- Page 228 and 229: Males Females 7.24 LIFE EXPECTANCY
- Page 230 and 231: 7.28 GROWTH AND COMPONENTS OF POPUL
- Page 232 and 233: ates in 2005-10 (rates above 3.0 pe
- Page 234 and 235: 7.35 CRUDE MARRIAGE RATE rate(a) 10
- Page 236 and 237: De facto partnering has arisen as a
- Page 238 and 239: 7.44 PROJECTED AVERAGE HOUSEHOLD SI
- Page 240 and 241: Families Between the 2001 and 2006
- Page 242 and 243: Characteristics of the population T
- Page 244 and 245: S7.4 PERSONS WHO SPEAK A LANGUAGE O
- Page 246 and 247: % 80 60 40 20 S7.6 RELIGIOUS AFFILI
- Page 248 and 249: people born in Australia become Aus
- Page 250 and 251: y people born in England, 9% by New
- Page 252 and 253: 8 LABOUR The information contained
- Page 254 and 255: Therefore, people in the labour for
- Page 256 and 257: 2004-05 2005-06 2006-07 2007-08 200
- Page 258 and 259: Family member Husband or partner Wi
- Page 260 and 261: eflects the higher participation of
- Page 264 and 265: 8.16 TYPES OF EMPLOYMENT, Proportio
- Page 266 and 267: 8.19 AVERAGE WEEKLY ACTUAL HOURS WO
- Page 268 and 269: only a single week in the month. Th
- Page 270 and 271: 8.24 INDEPENDENT CONTRACTORS, propo
- Page 272 and 273: % 80 60 8.28 FORM OF EMPLOYMENT , B
- Page 274 and 275: Place of Usual Residence(b) New Sou
- Page 276 and 277: Managers Professionals Technicians
- Page 278 and 279: 8.36 UNEMPLOYED PERSONS, Level of h
- Page 280 and 281: 8.39 LABOUR FORCE UNDERUTILISATION
- Page 282 and 283: 8.42 LABOUR FORCE STATUS(a)—Septe
- Page 284 and 285: 8.45 AVERAGE WEEKLY EARNINGS(a), By
- Page 286 and 287: tribunal-based systems of conciliat
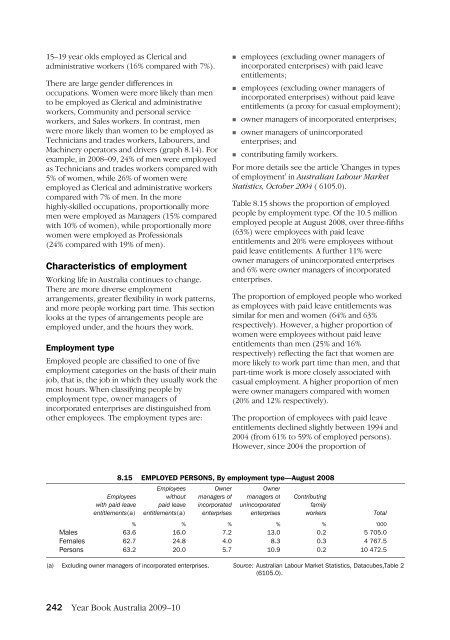
- Page 288 and 289: The proportion of employees who had
- Page 290 and 291: 2004 2005 2006 2007 2008 8.54 INDUS
- Page 292 and 293: 8.59 EMPLOYEES WHO WERE TRADE UNION
- Page 294: Bibliography ABS products Australia
- Page 297 and 298: Household income, expenditure and w
- Page 299 and 300: 9.3 INCOME AND HOUSEHOLD CHARACTERI
- Page 301 and 302: 9.5 DISTRIBUTION OF EQUIVALISED DIS
- Page 303 and 304: 9.7 HOUSEHOLD EXPENDITURE AND CHARA
- Page 305 and 306: 9.8 HOUSEHOLD ASSETS AND LIABILITIE
- Page 307 and 308: support, compensation and rehabilit
- Page 309 and 310: 9.9 EXPENDITURE ON MAJOR INCOME SUP
- Page 311 and 312: 9.12 OPERATIONAL AGED CARE PLACES(a
- Page 313 and 314:
9.15 MILITARY COMPENSATION AND REHA
- Page 315 and 316:
Other services include vocational r
- Page 317 and 318:
Table 9.18 shows the number of News
- Page 319 and 320:
Other vulnerable groups within comm
- Page 321 and 322:
Youth services and support Young jo
- Page 323 and 324:
• Family Relationship Services
- Page 325 and 326:
Communities The strength of communi
- Page 327 and 328:
Rural and remote support and servic
- Page 329 and 330:
Indigenous disadvantage and selecte
- Page 331 and 332:
S9.1 SELECTED PERFORMANCE INDICATOR
- Page 333 and 334:
S9.4 NEIGHBOURHOOD PROBLEMS BY REMO
- Page 335 and 336:
A key factor in reducing obesity ra
- Page 337 and 338:
2008, around one-quarter (24%) of I
- Page 339 and 340:
Types of dwellings A small proporti
- Page 341 and 342:
% 100 80 10.4 HOUSEHOLDS WITH ONE O
- Page 343 and 344:
10.7 OWNER AND RENTER HOUSEHOLDS, B
- Page 345 and 346:
10.10 AVERAGE REAL WEEKLY HOUSING C
- Page 347 and 348:
Hobart, particularly for owners wit
- Page 349 and 350:
10.17 HOUSING FINANCE FOR OWNER OCC
- Page 351 and 352:
Housing and life cycle stages As pe
- Page 353 and 354:
$ 500 400 10.23 AVERAGE WEEKLY HOUS
- Page 355 and 356:
ecent home buyers compared with 10%
- Page 357 and 358:
10.26 CSHA, Payments to states and
- Page 359 and 360:
National Rental Affordability Schem
- Page 361 and 362:
National Partnership Agreement on R
- Page 363 and 364:
Bibliography ABS products Australia
- Page 365 and 366:
How Australians rate their health T
- Page 367 and 368:
11.4 DEATH RATES FROM CARDIOVASCULA
- Page 369 and 370:
11.6 LIFE EXPECTANCY AT BIRTH, OECD
- Page 371 and 372:
Children who are overweight or obes
- Page 373 and 374:
11.11 PROPORTION OF CHILDREN'S TIME
- Page 375 and 376:
11.13 DEATH RATES FOR CARDIOVASCULA
- Page 377 and 378:
Morbidity The 2007-08 National Heal
- Page 379 and 380:
Mortality In 2007, diabetes mellitu
- Page 381 and 382:
11.17 PROPORTION OF PEOPLE AGED 16-
- Page 383 and 384:
alcohol). These were more likely to
- Page 385 and 386:
11.23) and 89% of six year olds wer
- Page 387 and 388:
11.22 CHARACTERISTICS OF CASES OF N
- Page 389 and 390:
• health services for war and def
- Page 391 and 392:
(a) (b) (c) 11.25 PHARMACEUTICAL BE
- Page 393 and 394:
which provides a tax-financed publi
- Page 395 and 396:
11.29 TOTAL HEALTH EXPENDITURE, 200
- Page 397 and 398:
Bibliography ABS products Australia
- Page 399 and 400:
'Global Strategy on Diet, Physical
- Page 401 and 402:
Government responsibilities in educ
- Page 403 and 404:
y 1% (table 12.2). Indigenous enrol
- Page 405 and 406:
problems is provided as 'special ed
- Page 407 and 408:
staff. Over the decade 1998 to 2008
- Page 409 and 410:
12.10 INDIGENOUS SCHOOL STUDENTS(a)
- Page 411 and 412:
12.14 VET COURSE ENROLMENTS(a), Voc
- Page 413 and 414:
12.17 WORK-RELATED TRAINING COURSES
- Page 415 and 416:
12.21 HIGHER EDUCATION STAFF(a) MAL
- Page 417 and 418:
12.23 PROPORTION OF OVERSEAS STUDEN
- Page 419 and 420:
12.27 DEMAND FOR EDUCATION, by age
- Page 421 and 422:
12.31 YOUTH PARTICIPATION IN EDUCAT
- Page 423 and 424:
12.35 MAIN FIELD OF HIGHEST NON- SC
- Page 425 and 426:
Financing education This section pr
- Page 427 and 428:
12.40 GOVERNMENT OPERATING EXPENSES
- Page 429 and 430:
Bibliography ABS products ANZSCO -
- Page 432 and 433:
13 CRIME AND JUSTICE The effects of
- Page 434 and 435:
13.1 FLOWS THROUGH THE CRIMINAL JUS
- Page 436 and 437:
data for ACC, AFP and the Northern
- Page 438 and 439:
• Kidnapping/abduction, 3.6 victi
- Page 440 and 441:
13.7 VICTIMS(a), By use of weapon i
- Page 442 and 443:
(a) (b) (c) Total of each state and
- Page 444 and 445:
proceeding. More serious offences a
- Page 446 and 447:
13.14 DEFENDANTS ADJUDICATED IN HIG
- Page 448 and 449:
13.17 DEFENDANTS ADJUDICATED IN MAG
- Page 450 and 451:
13.20 DEFENDANTS ADJUDICATED IN CHI
- Page 452 and 453:
e transferred to adult corrective s
- Page 454 and 455:
13.26 SENTENCED PRISONERS, By selec
- Page 456 and 457:
13.30 YOUNG PERSONS IN COMMUNITY- B
- Page 458 and 459:
Personal fraud Personal fraud has b
- Page 460:
oth, or seeking more information. T
- Page 463 and 464:
Arts and cultural heritage Experien
- Page 465 and 466:
14.3 CHILDRENS PARTICIPATION AND AT
- Page 467 and 468:
14.6 MUSEUMS, AT 30 JUNE 2008 Locat
- Page 469 and 470:
14.10 AVERAGE COST PER HOUR, By typ
- Page 471 and 472:
Table 14.12 shows the number of peo
- Page 473 and 474:
14.14 PARTICIPATION IN SPORTS AND P
- Page 475 and 476:
14.19 CHILDREN PARTICIPATING IN SEL
- Page 477 and 478:
14.21 GOVERNMENT FUNDING FOR ORGANI
- Page 479 and 480:
14.23 PERSONS EMPLOYED IN SELECTED
- Page 481 and 482:
There were 1.6 million people (9.9%
- Page 483 and 484:
14.26 PARTICIPANTS, SPORT AND PHYSI
- Page 485 and 486:
14.28 CHILDREN'S PARTICIPATION AND
- Page 487 and 488:
References Australian Bureau of Sta
- Page 490 and 491:
15 INDUSTRY STRUCTURE AND PERFORMAN
- Page 492 and 493:
15.1 INDUSTRY GROSS VALUE ADDED AND
- Page 494 and 495:
15.3 CONTRIBUTION TO GROSS DOMESTIC
- Page 496 and 497:
15.5 AVERAGE WEEKLY TOTAL PAID HOUR
- Page 498 and 499:
15.8 BUSINESS ENTRY AND EXIT RATES(
- Page 500 and 501:
15.11 GROSS VALUE ADDED PER HOUR WO
- Page 502:
Bibliography ABS products Australia
- Page 505 and 506:
Agricultural environment Australia'
- Page 507 and 508:
16.3 PASTURES AND CROPS IRRIGATED -
- Page 509 and 510:
16.5 BUSINESSES UNDERTAKING AGRICUL
- Page 511 and 512:
Crops Cereals for grain Wheat Oats
- Page 513 and 514:
16.10 BROADACRE FARM BUSINESSES, Fa
- Page 515 and 516:
16.15 SELECTED ORCHARD CROPS, Tree
- Page 517 and 518:
16.19 OATS PRODUCTION AND AREA BY S
- Page 519 and 520:
2005-06 2006-07 2007-08 16.22 VITIC
- Page 521 and 522:
16.26 LIVESTOCK NUMBERS, By Austral
- Page 523 and 524:
16.29 SHEEP AND LAMBS(a) —1888 to
- Page 525 and 526:
16.34 GROSS VALUE OF LIVESTOCK SLAU
- Page 527 and 528:
16.38), approaching a third of the
- Page 529 and 530:
16.40 FARMER ACTIVITY SUPPORTING BI
- Page 531 and 532:
Bibliography ABS products Australia
- Page 533 and 534:
Forestry Australia's native and pla
- Page 535 and 536:
17.2 PLANTATION AREAS - 2008 NSW Vi
- Page 537 and 538:
17.6 PRODUCTION OF WOOD AND SELECTE
- Page 539 and 540:
Finfish Tuna Other Total Crustacean
- Page 541 and 542:
products, taking $554m worth of pro
- Page 543 and 544:
overfished stocks and continued hig
- Page 545 and 546:
Bibliography ABS products Australia
- Page 548 and 549:
18 MINING Mining broadly relates to
- Page 550 and 551:
18.2 ECONOMIC DEMONSTRATED RESOURCE
- Page 552 and 553:
18.5 MINERAL EXPLORATION EXPENDITUR
- Page 554 and 555:
18.9 MINING INDUSTRY CONTRIBUTION T
- Page 556 and 557:
18.12 MINING INDUSTRY(a), Acquisiti
- Page 558 and 559:
Bauxite Copper (metal content) Gold
- Page 560 and 561:
18.17 PRODUCTION OF PRINCIPAL MANUF
- Page 562 and 563:
18.19 EXPORTS OF MAJOR MINERALS, OI
- Page 564 and 565:
18.22 IMPORTS OF MAJOR MINERALS AND
- Page 566 and 567:
18.25 SELECTED MINES AND DEPOSITS O
- Page 568 and 569:
6,255 tonnes, the second largest in
- Page 570 and 571:
Exports of uranium oxide in 2007-08
- Page 572 and 573:
Liquefied petroleum gas (LPG) LPG i
- Page 574:
Geoscience Australia, last viewed S
- Page 577 and 578:
Resources Australia has large ident
- Page 579 and 580:
19.4 ENERGY SUPPLY AND USE—2007-0
- Page 581 and 582:
International trade in energy produ
- Page 583 and 584:
2002-03, energy use by the electric
- Page 585 and 586:
Energy in Australia In response to
- Page 587 and 588:
19.18 GAS SUPPLY, KEY DATA ITEMS, 2
- Page 589 and 590:
19.20 GAS SUPPLY CHAIN PHYSICAL FLO
- Page 591 and 592:
19.24 ENERGY INTENSITY: AGRICULTURE
- Page 594 and 595:
20 MANUFACTURING Manufacturing broa
- Page 596 and 597:
manufacturing division as defined i
- Page 598 and 599:
20.6 MANUFACTURING INDUSTRY(a), Val
- Page 600 and 601:
leather, clothing and footwear manu
- Page 602 and 603:
20.11 MANUFACTURING INDUSTRY(a), Bu
- Page 604 and 605:
20.15 VALUE OF MERCHANDISE IMPORTS
- Page 606 and 607:
(both falling by around 14%), butte
- Page 608 and 609:
Commodity group(b) Road vehicles (i
- Page 610 and 611:
21 CONSTRUCTION The construction in
- Page 612 and 613:
21.2 CONSTRUCTION INDUSTRY, Employm
- Page 614 and 615:
2007-08 2008-09 21.7 VALUE OF BUILD
- Page 616 and 617:
Roads, highways and subdivisions Br
- Page 618 and 619:
22 SERVICE INDUSTRIES This chapter
- Page 620 and 621:
22.2 SERVICE INDUSTRIES(a), Employm
- Page 622 and 623:
22.5 MUSEUMS—2007- 08 Museum/gall
- Page 624 and 625:
takeaway food services are excluded
- Page 626 and 627:
Businesses/organisations at end Jun
- Page 628 and 629:
22.12 ACCOMMODATION ESTABLISHMENTS
- Page 630 and 631:
22.13 TELEVISION, FILM AND VIDEO PR
- Page 632 and 633:
Culture and recreation Education an
- Page 634:
Bibliography ABS products Australia
- Page 637 and 638:
Tourism industry Tourism is not an
- Page 639 and 640:
International visitor arrivals Ther
- Page 641 and 642:
% 40 23.10 SHORT-TERM INTERNATIONAL
- Page 643 and 644:
% 40 23.15 DAY VISITORS(a), By stat
- Page 645 and 646:
23.19 HOTELS, MOTELS AND SERVICED A
- Page 648 and 649:
24 TRANSPORT Transport activity inv
- Page 650 and 651:
24.3 TRANSPORT, POSTAL AND WAREHOUS
- Page 652 and 653:
towing) and other aerial work (incl
- Page 654 and 655:
24.11 TOTAL FUEL CONSUMPTION(a), Ty
- Page 656 and 657:
24.13 MOTOR VEHICLE USE, By state/t
- Page 658 and 659:
24.18 INTERNATIONAL PASSENGERS, Aus
- Page 660 and 661:
24.23 ROAD FATALITY RATES rate Per
- Page 662 and 663:
24.26 AIR ACCIDENTS, FATALITIES AND
- Page 664 and 665:
ut does not include vessels that ca
- Page 666 and 667:
25 INFORMATION AND COMMUNICATION TE
- Page 668 and 669:
Industry Manufacturing Computer and
- Page 670 and 671:
the proportion dropped from 94% to
- Page 672 and 673:
25.6 PROPORTION OF FARMS NOT USING
- Page 674 and 675:
'000 8000 6000 25.9 INTERNET SUBSCR
- Page 676 and 677:
Characteristics Age group (years) 1
- Page 678:
Bibliography ABS products Children'
- Page 681 and 682:
Research and experimental developme
- Page 683 and 684:
26.4 BUSINESS EXPENDITURE ON R&D/GD
- Page 685 and 686:
26.7 BUSINESSES INVOLVED IN INNOVAT
- Page 687 and 688:
Bibliography ABS products Australia
- Page 689 and 690:
Regulatory framework From 1 July 19
- Page 691 and 692:
central bank, and from 1959 to 1998
- Page 693 and 694:
industry, the life insurance indust
- Page 695 and 696:
Other insurance corporations This s
- Page 697 and 698:
(a) (b) 27.11 FINANCIAL INTERMEDIAR
- Page 699 and 700:
27.15 EQUITY MARKET(a)—30 June 20
- Page 701 and 702:
27.19 BONDS AMOUNTS OUTSTANDING AT
- Page 703 and 704:
Currencies are traded for many reas
- Page 705 and 706:
27.25 ASSETS OF MANAGED FUNDS, Inve
- Page 707 and 708:
27.31 VALUE OF AUSTRALIAN DECIMAL C
- Page 709 and 710:
“toxic” securities that severel
- Page 712 and 713:
28 GOVERNMENT FINANCE The main func
- Page 714 and 715:
GFS Revenue GFS Expenses GFS Net Op
- Page 716 and 717:
Assets Finanical assets Non-financi
- Page 718 and 719:
28.8 TAXATION PER PERSON(a), By lev
- Page 720 and 721:
29 PRICES Prices are a key factor i
- Page 722 and 723:
contents and services; Health; Tran
- Page 724 and 725:
29.4 ANALYTICAL LIVING COST INDEXES
- Page 726 and 727:
29.6 RETAIL/CONSUMER PRICE INDEX, A
- Page 728 and 729:
29.8 PENSIONER AND BENEFICIARY LIVI
- Page 730 and 731:
Labour price index (LPI) The LPI me
- Page 732 and 733:
constructed separately for establis
- Page 734 and 735:
29.16 STAGE OF PRODUCTION PRICE IND
- Page 736 and 737:
29.19 MANUFACTURING DIVISION INPUT
- Page 738 and 739:
29.23 PRICE INDEX OF SELECTED OUTPU
- Page 740 and 741:
2005 International Comparison Progr
- Page 742 and 743:
Price level index (USA = 100.0) 200
- Page 744:
Bibliography ABS products A Guide t
- Page 747 and 748:
Defining and measuring GDP Australi
- Page 749 and 750:
For many years the Australian Burea
- Page 751 and 752:
30.5 WAGES SHARE OF TOTAL FACTOR IN
- Page 753 and 754:
30.9 NATIONAL CAPITAL ACCOUNT, Curr
- Page 755 and 756:
Income of non-residents Imports of
- Page 757 and 758:
30.16 GROWTH IN GSP PER PERSON (a)
- Page 759 and 760:
30.18 CHANGE IN TOTAL NET WORTH—-
- Page 761 and 762:
Financial Accounts The ABS produces
- Page 763 and 764:
Fifty years of Quarterly National A
- Page 766 and 767:
31 INTERNATIONAL ACCOUNTS AND TRADE
- Page 768 and 769:
31.1 RELATIONSHIP BETWEEN THE BALAN
- Page 770 and 771:
exports and imports statistics by c
- Page 772 and 773:
Current account Goods and services
- Page 774 and 775:
31.6 CHAIN VOLUME MEASURES, IMPLICI
- Page 776 and 777:
31.10 INTERNATIONAL MERCHANDISE IMP
- Page 778 and 779:
31.12 SERVICES EXPORTS, Top 10 Coun
- Page 780 and 781:
Total 2006-07 2007-08 2008-09 Equit
- Page 782 and 783:
Articles in previous issues This se
- Page 784 and 785:
Women in prison, 371 100 years of c
- Page 786 and 787:
R&D in the Information and Communic
- Page 788 and 789:
Acknowledgements ABS publications,
- Page 790 and 791:
INDEX A AANZFTA, 153, 162 abalone,
- Page 792 and 793:
airports, 636, 637 airtime sales, 6
- Page 794 and 795:
Australia-Indonesia Free Trade Agre
- Page 796 and 797:
ills of exchange, 677 biodiversity,
- Page 798 and 799:
international, 746-8, 750 capital c
- Page 800 and 801:
temperatures, 65, 71, 72-3, 74, 75,
- Page 802 and 803:
Corporations Act 2001 (corporations
- Page 804 and 805:
children playing, 352, 444, 654 Dig
- Page 806 and 807:
states and territories, 140-1, 142-
- Page 808 and 809:
GDP ratios, 733, 735 manufacturing,
- Page 810 and 811:
forest fires, see bushfires forests
- Page 812 and 813:
youth and students, 299 see also Ag
- Page 814 and 815:
home loans (mortgages), 284, 285, 3
- Page 816 and 817:
Indigenous Australians and communit
- Page 818 and 819:
HIV and AIDS diagnosis per capita r
- Page 820 and 821:
Language, Literacy and Numeracy Sup
- Page 822 and 823:
extinct species, 7 invasive species
- Page 824 and 825:
management, 304-5 money base, 685-6
- Page 826 and 827:
net lending, 731, 733, 734 GFS oper
- Page 828 and 829:
operating profit before tax (OPBT),
- Page 830 and 831:
see also irrigation; livestock and
- Page 832 and 833:
houses, 326, 327, 328, 710-12 publi
- Page 834 and 835:
labour force underutilisation, 260
- Page 836 and 837:
un-off, see rivers and drainage rur
- Page 838 and 839:
see also wool shipping (water trans
- Page 840 and 841:
motor vehicles, 84-5, 86, 635, 637-
- Page 842 and 843:
three storey flat, unit or apartmen
- Page 844 and 845:
eef exports to, 504-5 fisheries pro
- Page 846 and 847:
weekly hours worked, see average we