IMPACT OF TAXES AND TRANSFERS
n?u=RePEc:tul:ceqwps:25&r=lam
n?u=RePEc:tul:ceqwps:25&r=lam

Create successful ePaper yourself
Turn your PDF publications into a flip-book with our unique Google optimized e-Paper software.
Enami, Lustig, Aranda, No. 25, November 2016<br />
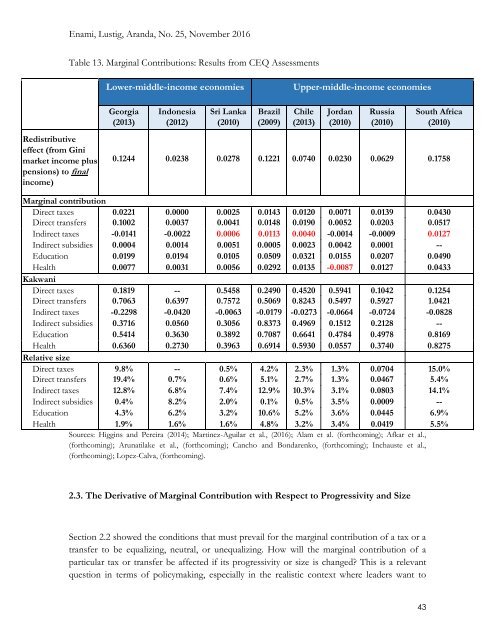
Table 13. Marginal Contributions: Results from CEQ Assessments<br />
Lower-middle-income economies<br />
Upper-middle-income economies<br />
Redistributive<br />
effect (from Gini<br />
market income plus<br />
pensions) to final<br />
income)<br />
Georgia<br />
(2013)<br />
Indonesia<br />
(2012)<br />
Sri Lanka<br />
(2010)<br />
Brazil<br />
(2009)<br />
Chile<br />
(2013)<br />
Jordan<br />
(2010)<br />
Russia<br />
(2010)<br />
South Africa<br />
(2010)<br />
0.1244 0.0238 0.0278 0.1221 0.0740 0.0230 0.0629 0.1758<br />
Marginal contribution<br />
Direct taxes 0.0221 0.0000 0.0025 0.0143 0.0120 0.0071 0.0139 0.0430<br />
Direct transfers 0.1002 0.0037 0.0041 0.0148 0.0190 0.0052 0.0203 0.0517<br />
Indirect taxes -0.0141 -0.0022 0.0006 0.0113 0.0040 -0.0014 -0.0009 0.0127<br />
Indirect subsidies 0.0004 0.0014 0.0051 0.0005 0.0023 0.0042 0.0001 --<br />
Education 0.0199 0.0194 0.0105 0.0509 0.0321 0.0155 0.0207 0.0490<br />
Health 0.0077 0.0031 0.0056 0.0292 0.0135 -0.0087 0.0127 0.0433<br />
Kakwani<br />
Direct taxes 0.1819 -- 0.5458 0.2490 0.4520 0.5941 0.1042 0.1254<br />
Direct transfers 0.7063 0.6397 0.7572 0.5069 0.8243 0.5497 0.5927 1.0421<br />
Indirect taxes -0.2298 -0.0420 -0.0063 -0.0179 -0.0273 -0.0664 -0.0724 -0.0828<br />
Indirect subsidies 0.3716 0.0560 0.3056 0.8373 0.4969 0.1512 0.2128 --<br />
Education 0.5414 0.3630 0.3892 0.7087 0.6641 0.4784 0.4978 0.8169<br />
Health 0.6360 0.2730 0.3963 0.6914 0.5930 0.0557 0.3740 0.8275<br />
Relative size<br />
Direct taxes 9.8% -- 0.5% 4.2% 2.3% 1.3% 0.0704 15.0%<br />
Direct transfers 19.4% 0.7% 0.6% 5.1% 2.7% 1.3% 0.0467 5.4%<br />
Indirect taxes 12.8% 6.8% 7.4% 12.9% 10.3% 3.1% 0.0803 14.1%<br />
Indirect subsidies 0.4% 8.2% 2.0% 0.1% 0.5% 3.5% 0.0009 --<br />
Education 4.3% 6.2% 3.2% 10.6% 5.2% 3.6% 0.0445 6.9%<br />
Health 1.9% 1.6% 1.6% 4.8% 3.2% 3.4% 0.0419 5.5%<br />
Sources: Higgins and Pereira (2014); Martinez-Aguilar et al., (2016); Alam et al. (forthcoming); Afkar et al.,<br />
(forthcoming); Arunatilake et al., (forthcoming); Cancho and Bondarenko, (forthcoming); Inchauste et al.,<br />
(forthcoming); Lopez-Calva, (forthcoming).<br />
2.3. The Derivative of Marginal Contribution with Respect to Progressivity and Size<br />
Section 2.2 showed the conditions that must prevail for the marginal contribution of a tax or a<br />
transfer to be equalizing, neutral, or unequalizing. How will the marginal contribution of a<br />
particular tax or transfer be affected if its progressivity or size is changed? This is a relevant<br />
question in terms of policymaking, especially in the realistic context where leaders want to<br />
43