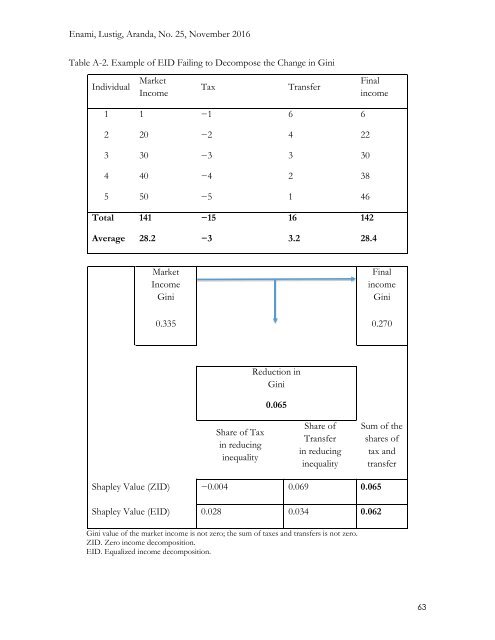
Enami, Lustig, Aranda, No. 25, November 2016 First, note that in this formula, S represents an element of set S Ii . Second, s is the dimensionality of each element of S that enters in the summation and n is the dimensionality of set N. It should be noted that s is the number of income sources that are already added and n − s − 1 is the number of sources that will not be added. Third, V ZID (S ∪ Ḭ i ) means the value function V allocates zero to any income source that is not included in set S (and it is not Ḭ i ). For example, if S = {Ḭ 2 , Ḭ 3 , Ḭ 4 , Ḭ 5 } then V ZID = V(0 , Ḭ 2 , Ḭ 3 , Ḭ 4 , Ḭ 5 , 0 , … ,0 ) Simple Shapley Value: EID Approach Using the same notation as in the previous section, the Shapley formula using the EID approach is (A-2) Sh Ii EID = ∑ ( (s!)×((n−s−1)!) S∈S (V EID (S ∪ Ḭ n! i ) − V EID Ii (S))). 51 The only difference here is that V EID (S) means the value function V allocates the average income to all individuals in the society for any income source that is not included in S. For example, if S = {Ḭ 2 , Ḭ 3 , Ḭ 4 , Ḭ 5 }, then the corresponding value function is V EID = V ((μ I1 × 1 ) , Ḭ 2 , Ḭ 3 , Ḭ 4 , Ḭ 5 , (μ I6 × 1 ), … , (μ In × 1 )) where 1 is a (m × 1) vector of ones and μ Ii is the average value of income source i. Note how the EID formula would run into problems if one tried to use it to explain a change in a value function (for example, the Gini coefficient) between a reference point that is not zero and an end point that has a different per-capita income in comparison to the reference point (that is, the sum of taxes and transfers is not zero). Assume the same example that is shown in table A-1. When total taxes and transfers are the same, the per-capita values are also equal and they cancel each other out, so the reference point remains the market income, that is, V (Market income, (μ Tax × 1), (μ Transfer × 1)) = V(Market income, 0,0) when μ Tax = −μ Transfer If the sum of taxes and transfers is not zero, the reference point is no longer market income and has a different value for the Gini coefficient, which results in the decomposition differing from the value we want to explain. Table A-2 shows this problem in a simple example. The sum of the EID Shapley values does not add up to the change in the Gini coefficient that we would like to explain. 51 Sastre and Trannoy (2002). 62
Enami, Lustig, Aranda, No. 25, November 2016 Table A-2. Example of EID Failing to Decompose the Change in Gini Individual Market Income Tax Transfer Final income 1 1 −1 6 6 2 20 −2 4 22 3 30 −3 3 30 4 40 −4 2 38 5 50 −5 1 46 Total 141 −15 16 142 Average 28.2 −3 3.2 28.4 Market Income Gini Final income Gini 0.335 0.270 Reduction in Gini 0.065 Share of Tax in reducing inequality Share of Transfer in reducing inequality Sum of the shares of tax and transfer Shapley Value (ZID) −0.004 0.069 0.065 Shapley Value (EID) 0.028 0.034 0.062 Gini value of the market income is not zero; the sum of taxes and transfers is not zero. ZID. Zero income decomposition. EID. Equalized income decomposition. 63
- Page 1 and 2:
ANALYTIC FOUNDATIONS: MEASURING THE
- Page 3 and 4:
ANALYTIC FOUNDATIONS: MEASURING THE
- Page 5 and 6:
Enami, Lustig, Aranda, No. 25, Nove
- Page 7 and 8:
Enami, Lustig, Aranda, No. 25, Nove
- Page 9 and 10:
Enami, Lustig, Aranda, No. 25, Nove
- Page 11 and 12: Enami, Lustig, Aranda, No. 25, Nove
- Page 13 and 14: Enami, Lustig, Aranda, No. 25, Nove
- Page 15 and 16: Enami, Lustig, Aranda, No. 25, Nove
- Page 17 and 18: Enami, Lustig, Aranda, No. 25, Nove
- Page 19 and 20: Enami, Lustig, Aranda, No. 25, Nove
- Page 21 and 22: Enami, Lustig, Aranda, No. 25, Nove
- Page 23 and 24: Enami, Lustig, Aranda, No. 25, Nove
- Page 25 and 26: Enami, Lustig, Aranda, No. 25, Nove
- Page 27 and 28: Enami, Lustig, Aranda, No. 25, Nove
- Page 29 and 30: Enami, Lustig, Aranda, No. 25, Nove
- Page 31 and 32: Enami, Lustig, Aranda, No. 25, Nove
- Page 33 and 34: Enami, Lustig, Aranda, No. 25, Nove
- Page 35 and 36: Enami, Lustig, Aranda, No. 25, Nove
- Page 37 and 38: Enami, Lustig, Aranda, No. 25, Nove
- Page 39 and 40: Enami, Lustig, Aranda, No. 25, Nove
- Page 41 and 42: Enami, Lustig, Aranda, No. 25, Nove
- Page 43 and 44: Enami, Lustig, Aranda, No. 25, Nove
- Page 45 and 46: Enami, Lustig, Aranda, No. 25, Nove
- Page 47 and 48: Enami, Lustig, Aranda, No. 25, Nove
- Page 49 and 50: Enami, Lustig, Aranda, No. 25, Nove
- Page 51 and 52: Enami, Lustig, Aranda, No. 25, Nove
- Page 53 and 54: Enami, Lustig, Aranda, No. 25, Nove
- Page 55 and 56: Enami, Lustig, Aranda, No. 25, Nove
- Page 57 and 58: Enami, Lustig, Aranda, No. 25, Nove
- Page 59 and 60: Enami, Lustig, Aranda, No. 25, Nove
- Page 61: Enami, Lustig, Aranda, No. 25, Nove
- Page 65 and 66: Enami, Lustig, Aranda, No. 25, Nove
- Page 67 and 68: Enami, Lustig, Aranda, No. 25, Nove
- Page 69 and 70: Enami, Lustig, Aranda, No. 25, Nove
- Page 71 and 72: Enami, Lustig, Aranda, No. 25, Nove