20495_Debenhams_AR_151104

You also want an ePaper? Increase the reach of your titles
YUMPU automatically turns print PDFs into web optimized ePapers that Google loves.
Figure 3: Cash flow, uses of cash and movement in net debt<br />
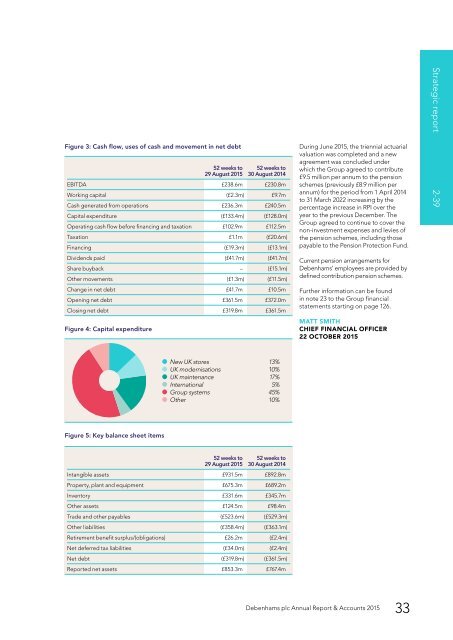
Figure 4: Capital expenditure<br />
52 weeks to<br />
29 August 2015<br />
52 weeks to<br />
30 August 2014<br />
EBITDA £238.6m £230.8m<br />
Working capital (£2.3m) £9.7m<br />
Cash generated from operations £236.3m £240.5m<br />
Capital expenditure (£133.4m) (£128.0m)<br />
Operating cash flow before financing and taxation £102.9m £112.5m<br />
Taxation £1.1m (£20.6m)<br />
Financing (£19.3m) (£13.1m)<br />
Dividends paid (£41.7m) (£41.7m)<br />
Share buyback – (£15.1m)<br />
Other movements (£1.3m) (£11.5m)<br />
Change in net debt £41.7m £10.5m<br />
Opening net debt £361.5m £372.0m<br />
Closing net debt £319.8m £361.5m<br />
During June 2015, the triennial actuarial<br />
valuation was completed and a new<br />
agreement was concluded under<br />
which the Group agreed to contribute<br />
£9.5 million per annum to the pension<br />
schemes (previously £8.9 million per<br />
annum) for the period from 1 April 2014<br />
to 31 March 2022 increasing by the<br />
percentage increase in RPI over the<br />
year to the previous December. The<br />
Group agreed to continue to cover the<br />
non-investment expenses and levies of<br />
the pension schemes, including those<br />
payable to the Pension Protection Fund.<br />
Current pension arrangements for<br />
<strong>Debenhams</strong>’ employees are provided by<br />
defined contribution pension schemes.<br />
Further information can be found<br />
in note 23 to the Group financial<br />
statements starting on page 126.<br />
MATT SMITH<br />
CHIEF FINANCIAL OFFICER<br />
22 OCTOBER 2015<br />
Strategic report 2-39<br />
New UK stores 13%<br />
UK modernisations 10%<br />
UK maintenance 17%<br />
International 5%<br />
Group systems 45%<br />
Other 10%<br />
Figure 5: Key balance sheet items<br />
52 weeks to<br />
29 August 2015<br />
52 weeks to<br />
30 August 2014<br />
Intangible assets £931.5m £892.8m<br />
Property, plant and equipment £675.3m £689.2m<br />
Inventory £331.6m £345.7m<br />
Other assets £124.5m £98.4m<br />
Trade and other payables (£523.6m) (£529.3m)<br />
Other liabilities (£358.4m) (£363.1m)<br />
Retirement benefit surplus/(obligations) £26.2m (£2.4m)<br />
Net deferred tax liabilities (£34.0m) (£2.4m)<br />
Net debt (£319.8m) (£361.5m)<br />
Reported net assets £853.3m £767.4m<br />
<strong>Debenhams</strong> plc Annual Report & Accounts 2015<br />
33