20495_Debenhams_AR_151104

Create successful ePaper yourself
Turn your PDF publications into a flip-book with our unique Google optimized e-Paper software.
We will continue to capture more emissions sources in the future. In addition, we will<br />
continue to invest in projects that will further support the reduction of our footprint<br />
and environmental impacts. This year we invested £739,628 across energy efficiency<br />
projects such as lighting, heating, cooling and controls, with additional investment<br />
planned in for 2015/16.<br />
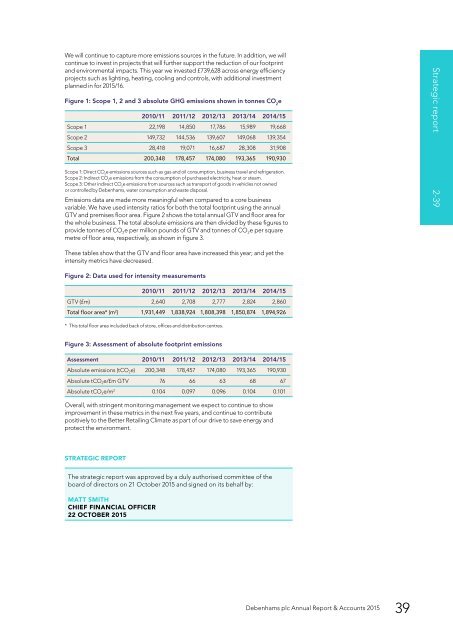
Figure 1: Scope 1, 2 and 3 absolute GHG emissions shown in tonnes CO 2<br />
e<br />
2010/11 2011/12 2012/13 2013/14 2014/15<br />
Scope 1 22,198 14,850 17,786 15,989 19,668<br />
Scope 2 149,732 144,536 139,607 149,068 139,354<br />
Scope 3 28,418 19,071 16,687 28,308 31,908<br />
Total 200,348 178,457 174,080 193,365 190,930<br />
Scope 1: Direct CO 2<br />
e emissions sources such as gas and oil consumption, business travel and refrigeration.<br />
Scope 2: Indirect CO 2<br />
e emissions from the consumption of purchased electricity, heat or steam.<br />
Scope 3: Other indirect CO 2<br />
e emissions from sources such as transport of goods in vehicles not owned<br />
or controlled by <strong>Debenhams</strong>, water consumption and waste disposal.<br />
Emissions data are made more meaningful when compared to a core business<br />
variable. We have used intensity ratios for both the total footprint using the annual<br />
GTV and premises floor area. Figure 2 shows the total annual GTV and floor area for<br />
the whole business. The total absolute emissions are then divided by these figures to<br />
provide tonnes of CO 2 e per million pounds of GTV and tonnes of CO 2 e per square<br />
metre of floor area, respectively, as shown in figure 3.<br />
Strategic report 2-39<br />
These tables show that the GTV and floor area have increased this year; and yet the<br />
intensity metrics have decreased.<br />
Figure 2: Data used for intensity measurements<br />
2010/11 2011/12 2012/13 2013/14 2014/15<br />
GTV (£m) 2,640 2,708 2,777 2,824 2,860<br />
Total floor area* (m 2 ) 1,931,449 1,838,924 1,808,398 1,850,874 1,894,926<br />
* This total floor area included back of store, offices and distribution centres.<br />
Figure 3: Assessment of absolute footprint emissions<br />
Assessment 2010/11 2011/12 2012/13 2013/14 2014/15<br />
Absolute emissions (tCO 2 e) 200,348 178,457 174,080 193,365 190,930<br />
Absolute tCO 2 e/£m GTV 76 66 63 68 67<br />
Absolute tCO 2 e/m 2 0.104 0.097 0.096 0.104 0.101<br />
Overall, with stringent monitoring management we expect to continue to show<br />
improvement in these metrics in the next five years, and continue to contribute<br />
positively to the Better Retailing Climate as part of our drive to save energy and<br />
protect the environment.<br />
STRATEGIC REPORT<br />
The strategic report was approved by a duly authorised committee of the<br />
board of directors on 21 October 2015 and signed on its behalf by:<br />
MATT SMITH<br />
CHIEF FINANCIAL OFFICER<br />
22 OCTOBER 2015<br />
<strong>Debenhams</strong> plc Annual Report & Accounts 2015<br />
39