


Create successful ePaper yourself
Turn your PDF publications into a flip-book with our unique Google optimized e-Paper software.
January 2017<br />
<strong>UGANDA</strong><br />
IMF Country Report No. 17/7<br />
SEVENTH REVIEW UNDER THE POLICY SUPPORT<br />
INSTRUMENT—PRESS RELEASE; AND STAFF REPORT<br />
In the context of the Seventh Review Under the Policy Support Instrument, the following<br />
documents have been released and are included in this package:<br />
<br />
<br />
<br />
<br />
A Press Release.<br />
The Staff Report prepared by a staff team of the IMF for the Executive Board’s<br />
consideration on a lapse of time basis, following discussions that ended on October<br />
26, 2016, with the officials of Uganda on economic developments and policies. Based<br />
on information available at the time of these discussions, the staff report was<br />
completed on December 16, 2016.<br />
An Informational Annex prepared by the IMF staff.<br />
A Debt Sustainability Analysis prepared by the staffs of the IMF and the World Bank.<br />
The documents listed below have been or will be separately released:<br />
Letter of Intent sent to the IMF by the authorities of Uganda*<br />
Memorandum of Economic and Financial Policies by the authorities of Uganda*<br />
Technical Memorandum of Understanding*<br />
*Also included in Staff Report<br />
The IMF’s transparency policy allows for the deletion of market-sensitive information and<br />
premature disclosure of the authorities’ policy intentions in published staff reports and<br />
other documents.<br />
Copies of this report are available to the public from<br />
International Monetary Fund Publication Services<br />
PO Box 92780 Washington, D.C. 20090<br />
Telephone: (202) 623-7430 Fax: (202) 623-7201<br />
E-mail: publications@imf.org Web: http://www.imf.org<br />
Price: $18.00 per printed copy<br />
International Monetary Fund<br />
Washington, D.C.<br />
© 2017 International Monetary Fund
Press Release No. 17/04<br />
FOR IMMEDIATE RELEASE<br />
January 10, 2017<br />
International Monetary Fund<br />
Washington, D.C. 20431 USA<br />
IMF Executive Board Completes the Seventh Review Under the Policy Support<br />
Instrument for Uganda<br />
On January 5, the Executive Board of the International Monetary Fund (IMF) completed the<br />
seventh review of Uganda’s economic program under the Policy Support Instrument (PSI). 1<br />
The Board’s decision was taken on a lapse of time basis. 2 In completing the review, the<br />
Board granted a waiver of the nonobservance of the end-June 2016 assessment criterion on<br />
the overall deficit of the central government.<br />
The PSI for Uganda was approved by the Board on June 28, 2013 (see Press Release No.<br />
13/78), and a one-year extension was approved on June 6, 2016 (see Press Release No.<br />
16/263).<br />
Uganda’s economy has performed reasonably well in a complex environment. Growth<br />
slowed marginally to 4.8 percent in FY15/16, reflecting muted sentiment in an election year<br />
and adverse global and regional developments. The current account deficit improved by<br />
1 percentage point to 5.9 percent of GDP, and the Shilling has stabilized after a sharp<br />
depreciation in 2015. Growth is projected to nudge up to 5 percent in FY16/17.<br />
Program performance under the PSI has been mixed. Tight monetary policy in 2015 has<br />
helped contain inflation in the target range, and the Bank of Uganda (BoU) has started an<br />
easing cycle in April 2016. Reserve cover remains adequate. Fiscal revenue and deficit<br />
targets were missed, reflecting lower-than-expected growth and election effects. Investment<br />
spending fell short, while current expenditure overshot. Structural reforms have progressed,<br />
albeit with some delays.<br />
1<br />
The PSI is an instrument of the IMF designed for countries that do not need balance of payments financial<br />
support. The PSI helps countries design effective economic programs that, once approved by the IMF's<br />
Executive Board, signal to donors, multilateral development banks, and markets the Fund's endorsement of a<br />
member's policies (see http://www.imf.org/external/np/exr/facts/psi.htm). Details on Uganda’s current PSI are<br />
available at www.imf.org/uganda.<br />
2<br />
The Executive Board takes decisions without a meeting when it is agreed by the Board that a proposal can be<br />
considered without convening formal discussions.
2<br />
The banking sector remains overall well capitalized, despite elevated non-performing loans.<br />
The BoU appropriately took over an undercapitalized bank and is identifying a strategic<br />
investor.<br />
Uganda remains at a low risk of debt distress. The scaling-up of infrastructure investment<br />
implies a temporary increase in debt, putting a premium on domestic revenue mobilization<br />
and ensuring that public investment yields the intended growth dividend.<br />
Looking ahead, priorities include close cooperation with the Financial Action Task Force to<br />
ensure Uganda’s swift exit from its “gray” list; strengthening domestic arrears monitoring;<br />
and amending the Bank of Uganda Act to reinforce central bank independence.
<strong>UGANDA</strong><br />
SEVENTH REVIEW UNDER THE POLICY SUPPORT INSTRUMENT<br />
December 16, 2016<br />
EXECUTIVE SUMMARY<br />
The economy has performed reasonably well in a complex environment. Growth slowed<br />
marginally in FY15/16, reflecting muted sentiment in an election year and adverse global and<br />
regional developments. Growth should nudge up in FY16/17 to 5 percent, low compared to<br />
past performance and regional peers. Credit to the private sector has stalled, and nonperforming<br />
loans (NPLs) have increased, also reflecting domestic government arrears. The<br />
current account deficit is fully financed. The Shilling has stabilized after a sharp depreciation<br />
in 2015, and international reserve coverage remains adequate.<br />
Program performance under the PSI has been mixed. Monetary policy tightening in 2015<br />
has helped contain inflation in the target range, and the Bank of Uganda (BoU) commenced an<br />
easing cycle in April. Lower than expected nominal growth and election-related spending<br />
resulted in missed revenue and deficit targets. The government partly relied on BoU advances<br />
for financing. Structural reforms have progressed, albeit with many delays.<br />
The authorities’ strategy of scaling up infrastructure investment remains appropriate,<br />
accompanied by supporting policies to safeguard debt sustainability. The debt<br />
sustainability analysis shows a low risk of debt distress, but vulnerabilities have increased. The<br />
authorities aim for a prudent deficit in FY16/17, supported by a ½ percent of GDP increase in<br />
tax collections. Ongoing reforms to public investment management need to ensure that<br />
infrastructure spending yields the intended growth dividend. The authorities’ emphasis on<br />
reducing domestic arrears is welcome, and needs to be followed with concrete action.<br />
The BoU is successfully steering inflation. Monetary policy has space for further easing, with<br />
food prices and the exchange rate being the main risks to the outlook.<br />
Overall, the banking sector remains well capitalized, despite elevated NPLs. The BoU has<br />
appropriately taken over an under-capitalized systemically important bank. Effective and swift<br />
resolution of this bank is a key priority.<br />
Near-term risks are to the downside. Uganda remains exposed to risks from adverse<br />
weather and global and regional developments. Continued problems with public investment<br />
efficiency would undermine growth prospects and debt sustainability.<br />
Staff recommends completing the seventh review under the PSI. Staff supports a waiver<br />
of the non-observance of the Quantitative Assessment Criterion on the ceiling on the overall<br />
deficit of the central government on the grounds that the non-observance was temporary.
<strong>UGANDA</strong><br />
Approved By<br />
Roger Nord (AFR) and<br />
Zuzana Murgasova<br />
(SPR)<br />
IMF team: A. Schimmelpfennig (head), R. Randall and Q. Cui (all<br />
AFR), A. Hodge (FAD), J. Bersch and F. Narita (SPR). C. Mira (resident<br />
representative) and L. Samula (local economist) also participated.<br />
E. Tawiah and T. Gursoy provided administrative and research<br />
support respectively.<br />
Discussions were held in Kampala during October 12–26, 2016. The<br />
mission met with President Museveni, Minister of Finance Kasaija,<br />
Bank of Uganda Governor Tumusiime-Mutebile, other senior<br />
government officials, as well as representatives from the private<br />
sector, civil society, and the international community.<br />
CONTENTS<br />
BACKGROUND AND RECENT DEVELOPMENTS ________________________________________________ 4<br />
PERFORMANCE UNDER THE PSI _______________________________________________________________ 12<br />
POLICY DISCUSSIONS __________________________________________________________________________ 13<br />
A. Fiscal Policy ____________________________________________________________________________________ 13<br />
B. Monetary Policy and Financial Stability ________________________________________________________ 14<br />
C. Financial Sector Development and Inclusion __________________________________________________ 16<br />
D. Debt Sustainability ____________________________________________________________________________ 17<br />
E. Program Design________________________________________________________________________________ 18<br />
STAFF APPRAISAL ______________________________________________________________________________ 18<br />
BOX<br />
1. Uganda’s Humanitarian Response _______________________________________________________________5<br />
FIGURES<br />
1. Real Sector Developments _______________________________________________________________________6<br />
2. External Sector Developments ___________________________________________________________________7<br />
3. Fiscal Sector Developments ______________________________________________________________________8<br />
4. Monetary Sector Developments _________________________________________________________________9<br />
5. Financial Sector Developments ________________________________________________________________ 10<br />
6. Other Financial Sector Developments _________________________________________________________ 11<br />
TABLES<br />
1. Selected Economic and Financial Indicators, FY2012/13–2020/21 _____________________________ 20<br />
2a. Fiscal Operations of the Central Government, FY2012/13–2017/18 (Billions of Shillings) ____ 21<br />
2b. Fiscal Operations of the Central Government, FY2012/13–2017/18 (Percent of GDP) ________ 22<br />
2 INTERNATIONAL MONETARY FUND
<strong>UGANDA</strong><br />
2c. Quarterly Fiscal Operations of the Central Government, 2015/16–2016/17 __________________ 23<br />
3. Monetary Accounts, FY2012/13–FY2017/18 ___________________________________________________ 24<br />
4. Balance of Payments, FY2012/13–2017/18 ____________________________________________________ 25<br />
5. Banking Sector Indicators, March 2013–June 2016 ____________________________________________ 26<br />
APPENDIX<br />
I. Letter of Intent _________________________________________________________________________________ 27<br />
Attachment I. Memorandum of Economic and Financial Policies ____________________________ 29<br />
Attachment II. Technical Memorandum of Understanding ___________________________________ 46<br />
INTERNATIONAL MONETARY FUND 3
<strong>UGANDA</strong><br />
BACKGROUND AND RECENT DEVELOPMENTS<br />
1. The political cycle has complicated policy making. The February 2016 presidential and<br />
parliamentary elections and the subsequent events weighed on sentiment. The elections also<br />
contributed to fiscal slippages. President Museveni was declared winner with 61 percent of the<br />
votes, and is now in his fifth term. Parliament and cabinet took office in June. The new<br />
government has reiterated the objective of reaching middle-income status by 2020 through<br />
infrastructure investment, agricultural growth, and supporting private sector job creation.<br />
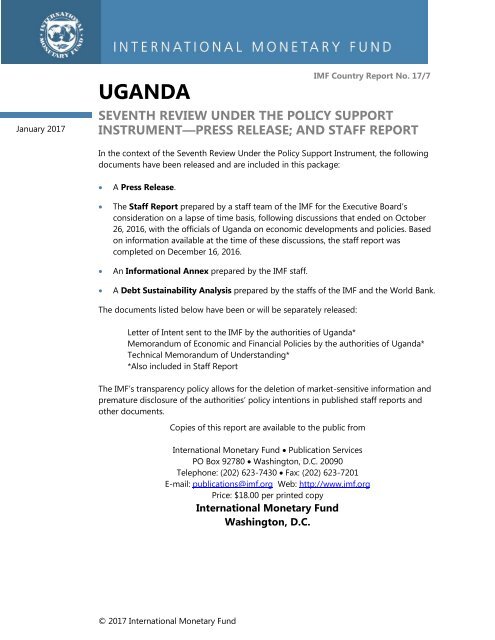
2. The economy has performed reasonably well in a complex environment.<br />
Growth slowed marginally to 4.8 percent in FY2015/16 from 5 percent in the previous year<br />
(Figure 1), as the elections and adverse global<br />
and regional developments, particularly in<br />
neighboring South Sudan, contributed to a<br />
slowdown in investments and exports. After a<br />
sharp depreciation in 2015, the shilling<br />
appreciated and stabilized as market<br />
sentiment improved. High frequency<br />
indicators suggest a strengthening of<br />
economic activity, with growth projected to<br />
nudge up to 5 percent in FY2016/17,<br />
supported by rising private and public<br />
investments. Nevertheless, growth lags<br />
behind the rates achieved in Uganda’s recent<br />
past and those of regional peers.<br />
12<br />
9<br />
6<br />
3<br />
0<br />
-3<br />
Per capita real GDP growth*<br />
(percent)<br />
Ethiopia Tanzania Rwanda<br />
Uganda Burundi Kenya<br />
FY10/11 FY11/12 FY12/13 FY13/14 FY14/15 FY15/16<br />
* Refer to FY data or calculated equivalents.<br />
12<br />
9<br />
6<br />
3<br />
0<br />
-3<br />
3. Despite significant progress over the last decade, poverty remains elevated.<br />
The poverty rate has come down from 62.2 percent in 2003 to about 34.6 percent in 2013, under<br />
the international poverty line. 1 Vulnerability to poverty also remains high, with about 43 percent<br />
of Ugandans classified as insecure non-poor. During 2005–09, two out of three<br />
non-poor fell back into poverty. Reducing poverty further also calls for higher and more inclusive<br />
growth. This challenge notwithstanding, Uganda is hosting refugees from South Sudan through a<br />
commendable integration model (Box I).<br />
4. The current account deficit narrowed by 1 percentage point to 5.9 percent of GDP in<br />
FY2015/16, but is expected to widen again. Imports dropped sharply, mainly due to lower oil<br />
price and delayed investments. This more than offset a decline in exports on account of weak<br />
1<br />
Based on the World Bank’s 2016 Uganda Poverty Assessment Report. The poverty rate refers to poverty<br />
headcount ratios measured by the international poverty line of 2011 international PPP$1.9 per day. Using<br />
Uganda’s national poverty line set over 20 years ago, the poverty rate declined from 38.8 percent in 2003 to<br />
19.7 percent in 2013.<br />
4 INTERNATIONAL MONETARY FUND
<strong>UGANDA</strong><br />
global and regional demand, including from South Sudan (Figure 2). In all, the overall balance<br />
recorded a small surplus. For FY2016/17, the current account deficit is projected to widen again,<br />
reflecting higher investments in infrastructure projects.<br />
5. The underlying private sector sentiment appears more muted than the headline<br />
numbers suggest. Export weakness, a virtual standstill in private sector credit expansion and<br />
problems in the banking sector, domestic government arrears, and arrears from South Sudan to<br />
Ugandan businesses who had been active there, are all creating an air of uneasiness and<br />
uncertainty. Morever, concerns of a possible drought also affect expectations.<br />
Box 1. Uganda’s Humanitarian Response<br />
Uganda has become one of the top refugee-hosting countries in Africa. The latest influx comes from<br />
conflict-torn South Sudan and about ten other countries. The total number of refugees in Uganda is<br />
estimated at over 922,000 (about 2¼ percent of the<br />
population), of which about 553,000 come from South<br />
Sudan. This has made Uganda one of the top countries<br />
hosting refugees in Africa. 1 Since September 2016, a<br />
record number of refugees have been arriving—about<br />
2,000 to 3,000 per day—the majority of which are<br />
women and children.<br />
Top African Countries in Hosting Refugees 1<br />
3.5<br />
Refugees in share of total population (percent)<br />
3<br />
No. of refugees (RHS, thousands)<br />
2.5<br />
2<br />
1.5<br />
900<br />
800<br />
700<br />
600<br />
500<br />
Uganda’s refugee policy provides for integration<br />
with the local communities, widely acclaimed as an<br />
international best practice. 2 The UNHCR has praised<br />
Uganda’s “non-camp” approach in the 2006 Refugee<br />
Act as “progressive and forward-thinking.” Under the<br />
Refugee and Host Population Empowerment program,<br />
refugees are given similar rights as nationals—including the right to work and establish businesses, free<br />
schooling and healthcare, freedom of movement, and allocation of agricultural land. By allowing refugees to<br />
work, the approach benefits host communities and facilitates deeper and faster refugee transitions. 3<br />
Ugandan authorities work closely with the UNHCR and UN partner agencies, in collaboration with the World<br />
Bank, and local and international NGOs. Refugee settlement has been included in Uganda’s National<br />
Development Plan II, thereby bringing together the humanitarian and the development aspects, and the<br />
government is promoting social service delivery in refugee-hosting areas.<br />
The cost of hosting refugees has been largely absorbed within existing programs, but challenges have<br />
emerged with the recent surge of refugees. The government’s refugee outlays are partly covered by the<br />
allocations for disaster preparedness, which were approved before the recent conflict in South Sudan<br />
erupted. The government’s contributions also include the allocation of communal land to newly arrived<br />
refugees and the enrollment of child refugees in schools. Other donor-financed programs include: access to<br />
training and general support for rural livelihoods, cash-based food assistance, healthcare services, and<br />
provision of water, sanitation and hygiene facilities, and other essential non-food items. With an increasing<br />
number of refugees, local government service delivery systems are being strained, not least because of<br />
shortfalls in donor funding. The continued high influx of refugees is also likely to constrain the size of<br />
available agricultural plots for refugees, which potentially threatens their food security and increases the<br />
burden placed on humanitarian assistance.<br />
1<br />
0.5<br />
0<br />
Uganda Ethiopia Kenya DRC Chad<br />
1,000<br />
Sources: Amnesty International, UNHCR, IMF World Economic Outlook, and staff calculations.<br />
1 Data are as of end-October 2016 for Uganda and end-2015 for other countries.<br />
400<br />
300<br />
200<br />
100<br />
0<br />
1<br />
See the UNHCR’s Revised South Sudan Regional Refugee Response Plan, January-December 2016.<br />
2<br />
See http://www.worldbank.org/en/topic/fragilityconflictviolence/brief/ugandas-progressive-approach-refugee-management.<br />
3<br />
See https://www.wfp.org/news/news-release/new-research-finds-humanitarian-assistance-refugees-boosts-ugandas-economy.<br />
INTERNATIONAL MONETARY FUND 5
<strong>UGANDA</strong><br />
Figure 1. Uganda: Real Sector Developments<br />
Growth has been stable at about<br />
5 percent in recent years.<br />
Leading indicators are rebounding,<br />
suggesting a recovery of economic<br />
activity from a year ago.<br />
10<br />
8<br />
6<br />
4<br />
2<br />
0<br />
Contribution to GDP Growth by Sector<br />
(percent, y-o-y)<br />
2009/10 2011/12 2013/14 2015/16<br />
Taxes on Products Services Industry Agriculture<br />
65<br />
63<br />
60<br />
58<br />
55<br />
53<br />
50<br />
48<br />
45<br />
Dec-12<br />
Mar-13<br />
Business Tendency Indicators<br />
(index)<br />
Overall Index<br />
Construction<br />
Manufacturing<br />
Wholesale Trade<br />
Jun-13<br />
Sep-13<br />
Dec-13<br />
Mar-14<br />
Jun-14<br />
Sep-14<br />
Dec-14<br />
Mar-15<br />
Jun-15<br />
Sep-15<br />
Dec-15<br />
Mar-16<br />
Jun-16<br />
Sep-16<br />
65<br />
63<br />
60<br />
58<br />
55<br />
53<br />
50<br />
48<br />
45<br />
After significantly depreciating prior to<br />
September 2015, the Shilling has<br />
appreciated and stabilized in nominal<br />
terms.<br />
Effective exchange rates have been<br />
broadly stable.<br />
4000<br />
3500<br />
Nominal Exchange Rate<br />
(Ugandan Shilling per foreign currency)<br />
40<br />
35<br />
120<br />
Nominal and Real Effective Exchange Rates<br />
(2010 base year, decrease indicates<br />
depreciation)<br />
120<br />
3000<br />
30<br />
100<br />
100<br />
2500<br />
25<br />
80<br />
80<br />
2000<br />
1500<br />
Dec-12<br />
Mar-13<br />
Jun-13<br />
Sep-13<br />
Dec-13<br />
Mar-14<br />
Jun-14<br />
Sep-14<br />
Dec-14<br />
Mar-15<br />
USH/USD<br />
USH/EUR<br />
USH/KSH (RHS)<br />
Jun-15<br />
Sep-15<br />
Dec-15<br />
Mar-16<br />
Jun-16<br />
Sep-16<br />
20<br />
15<br />
60<br />
Real effective exchange rate<br />
Average REER (Jan 2010-July 2017)<br />
Nominal effective exchange rate<br />
40<br />
Dec-12<br />
Mar-13<br />
Jun-13<br />
Sep-13<br />
Dec-13<br />
Mar-14<br />
Jun-14<br />
Sep-14<br />
Dec-14<br />
Mar-15<br />
Jun-15<br />
Sep-15<br />
Dec-15<br />
Mar-16<br />
Jun-16<br />
Sep-16<br />
60<br />
40<br />
Core inflation has returned to the<br />
BoU’s target range.<br />
Price movements across several CPI<br />
sub-groups mirror the overall trend.<br />
12<br />
Inflation Rates*<br />
(percent, y-o-y)<br />
12<br />
15<br />
Inflation Rates by Component<br />
(percent, y-o-y)<br />
15<br />
10<br />
8<br />
10<br />
8<br />
10<br />
10<br />
6<br />
4<br />
Core<br />
Headline<br />
6<br />
4<br />
5<br />
0<br />
5<br />
0<br />
2<br />
0<br />
Jun-13<br />
Sep-13<br />
Dec-13<br />
Mar-14<br />
Jun-14<br />
Sep-14<br />
Dec-14<br />
Mar-15<br />
Jun-15<br />
Sep-15<br />
Dec-15<br />
Mar-16<br />
Jun-16<br />
Sep-16<br />
* Dash and dot lines show the outer and inner band of average core inflation<br />
target.<br />
2<br />
0<br />
-5<br />
-10<br />
Housing, Water, Electricity, Gas and Other Fuels<br />
Food and Non-Alcoholic Beverages<br />
Health<br />
Transport<br />
Dec-12<br />
Mar-13<br />
Jun-13<br />
Sep-13<br />
Dec-13<br />
Mar-14<br />
Jun-14<br />
Sep-14<br />
Dec-14<br />
Mar-15<br />
Jun-15<br />
Sep-15<br />
Dec-15<br />
Mar-16<br />
Jun-16<br />
Sep-16<br />
-5<br />
-10<br />
Sources: Bank of Uganda, Uganda Bureau of Statistics, and IMF staff calculations.<br />
6 INTERNATIONAL MONETARY FUND
<strong>UGANDA</strong><br />
Figure 2. Uganda: External Sector Developments<br />
The current account deficit narrowed in FY15/16…<br />
10<br />
8<br />
6<br />
Current Account Deficit<br />
(percent of GDP)<br />
10<br />
8<br />
6<br />
… due to a sharp drop in imports, associated with public<br />
investment delays.<br />
30<br />
20<br />
10<br />
Trade and Service Developments<br />
(percentage change)<br />
Exports of goods<br />
Exports of services<br />
Imports of goods<br />
Imports of services<br />
30<br />
20<br />
10<br />
4<br />
4<br />
0<br />
0<br />
2<br />
2<br />
-10<br />
-10<br />
0<br />
2009/10<br />
2010/11<br />
2011/12<br />
2012/13<br />
2013/14<br />
2014/15<br />
2015/16<br />
0<br />
-20<br />
2009/10<br />
2010/11<br />
2011/12<br />
2012/13<br />
2013/14<br />
2014/15<br />
2015/16<br />
-20<br />
The capital and financial account also declined with lower<br />
FDI and project loans and portfolio outflows.<br />
However, foreign investors’ participation in government<br />
securities has recently rebounded.<br />
12<br />
10<br />
8<br />
6<br />
4<br />
2<br />
0<br />
-2<br />
Financial and Capital Account<br />
(percent of GDP)<br />
Capital transfers<br />
Financial derivatives<br />
Other investment<br />
Portfolio investment<br />
Direct investment<br />
Capital & financial account<br />
12<br />
10<br />
8<br />
6<br />
4<br />
2<br />
0<br />
-2<br />
2009/10<br />
2010/11<br />
2011/12<br />
2012/13<br />
2013/14<br />
2014/15<br />
2015/16<br />
Share of Government Securities Held by Offshore Investors<br />
14<br />
(share of total, percent, through August '16)<br />
14<br />
Treasury bills<br />
12<br />
Treasury bonds<br />
12<br />
10<br />
10<br />
8<br />
8<br />
6<br />
6<br />
4<br />
4<br />
2<br />
2<br />
0<br />
0<br />
Jan-14<br />
Apr-14<br />
Jul-14<br />
Oct-14<br />
Jan-15<br />
Apr-15<br />
Jul-15<br />
Oct-15<br />
Jan-16<br />
Apr-16<br />
Jul-16<br />
Higher infrastructure investments contributed to a buildup of public<br />
and private external debt.<br />
The reserves buffer remains comfortable.<br />
40<br />
30<br />
20<br />
10<br />
External Debt<br />
(percent of GDP)<br />
Private sector external debt<br />
Public sector external debt<br />
40<br />
30<br />
20<br />
10<br />
4,000<br />
3,750<br />
3,500<br />
3,250<br />
3,000<br />
2,750<br />
International Reserve Buffers<br />
Gross reserves (millions of US$)<br />
Months of next year's imports (RHS)<br />
6<br />
5<br />
4<br />
0<br />
2009/10<br />
2010/11<br />
2011/12<br />
2012/13<br />
2013/14<br />
2014/15<br />
2015/16<br />
0<br />
2,500<br />
Mar-14<br />
Jun-14<br />
Sep-14<br />
Dec-14<br />
Mar-15<br />
Jun-15<br />
Sep-15<br />
Dec-15<br />
Mar-16<br />
Jun-16<br />
3<br />
Sources: Bank of Uganda and IMF staff calculations.<br />
INTERNATIONAL MONETARY FUND 7
<strong>UGANDA</strong><br />
Figure 3. Uganda: Fiscal Sector Developments<br />
14<br />
12<br />
10<br />
8<br />
6<br />
4<br />
2<br />
Tax revenues have picked up…<br />
Total Revenue<br />
(percent of GDP)<br />
International trade taxes<br />
Excises<br />
Other*<br />
Income taxes<br />
Value-added tax<br />
0<br />
0<br />
2009/10 2011/12 2013/14 2015/16<br />
* 'Other' includes non-tax and oil revenues<br />
14<br />
12<br />
10<br />
8<br />
6<br />
4<br />
2<br />
2.5<br />
2.0<br />
1.5<br />
1.0<br />
0.5<br />
…and grants are recovering.<br />
Grants<br />
(percent of GDP)<br />
Budget support<br />
Project grants<br />
0.0<br />
0.0<br />
2009/10 2011/12 2013/14 2015/16<br />
2.5<br />
2.0<br />
1.5<br />
1.0<br />
0.5<br />
Current expenditures increased...<br />
…including in higher poverty-alleviating<br />
expenditures …<br />
30<br />
Total Expenditures<br />
(percent of GDP)<br />
30<br />
Poverty Alleviating Expenditure<br />
(percent of GDP)<br />
25<br />
20<br />
15<br />
10<br />
5.6<br />
Net lending and investment<br />
Development expenditures<br />
Current expenditures<br />
5.9<br />
5.8 6.5<br />
7.0 6.7<br />
7.0<br />
25<br />
20<br />
15<br />
10<br />
4<br />
3<br />
2<br />
Program<br />
Actual<br />
4<br />
3<br />
2<br />
5<br />
10.5<br />
12.7<br />
9.4 9.0 9.5 9.9 10.8<br />
5<br />
0<br />
2009/10 2011/12 2013/14 2015/16<br />
0<br />
1<br />
2011/12 2012/13 2013/14 2014/15 2015/16<br />
1<br />
…leading to higher overall deficit…<br />
…and increased public debt.<br />
6<br />
Overall Deficit<br />
(percent of GDP)<br />
6<br />
40<br />
Public Debt<br />
(percent of GDP)<br />
40<br />
5<br />
4<br />
3<br />
2<br />
1<br />
0<br />
-1<br />
-1<br />
2009/10 2011/12 2013/14 2015/16<br />
Float<br />
Domestic financing (net)<br />
External financing (net)<br />
Overall deficit<br />
5<br />
4<br />
3<br />
2<br />
1<br />
0<br />
35<br />
30<br />
25<br />
20<br />
15<br />
10<br />
5<br />
0<br />
Public domestic debt<br />
Public external debt<br />
2009/10 2011/12 2013/14 2015/16<br />
35<br />
30<br />
25<br />
20<br />
15<br />
10<br />
5<br />
0<br />
Sources: Ministry of Finance and IMF staff calculations.<br />
8 INTERNATIONAL MONETARY FUND
<strong>UGANDA</strong><br />
Figure 4. Uganda: Monetary Sector Developments<br />
The central bank rate has been reduced by 400 bps since<br />
April…<br />
30<br />
25<br />
20<br />
15<br />
Central Bank and Interbank Rates<br />
(percent)<br />
Central Bank rate<br />
7-day interbank rate<br />
30<br />
25<br />
20<br />
15<br />
14<br />
12<br />
10<br />
8<br />
6<br />
4<br />
...as the inflation forecast stayed close to target.<br />
Core Inflation Forecast<br />
(annual average percent change)*<br />
Inner band (+/-2%)<br />
Core Inflation<br />
Projections<br />
Inflation target<br />
Outer band (+/-3%)<br />
10<br />
5<br />
Jan-12<br />
Apr-12<br />
Jul-12<br />
Oct-12<br />
Jan-13<br />
Apr-13<br />
Jul-13<br />
Oct-13<br />
Jan-14<br />
Apr-14<br />
Jul-14<br />
Oct-14<br />
Jan-15<br />
Apr-15<br />
Jul-15<br />
Oct-15<br />
Jan-16<br />
Apr-16<br />
Jul-16<br />
Oct-16<br />
10<br />
5<br />
2<br />
0<br />
Sep-13 Feb-14 Jul-14 Dec-14May-15 Oct-15 Mar-16Aug-16 Jan-17 Jun-17<br />
*This is calculated as the 12-month average of the y-o-y percent change of Core CPI.<br />
Sources: Bank of Uganda and IMF Staff Calculations<br />
Treasury bill rates declined after the elections…<br />
…while lending rates remain high.<br />
24<br />
22<br />
20<br />
18<br />
16<br />
14<br />
12<br />
10<br />
8<br />
Jan-12<br />
Jul-12<br />
Evolution of Treasury Bill Rates<br />
(percent)<br />
Jan-13<br />
Jul-13<br />
182 Days<br />
91 Days<br />
364 Days<br />
Central Bank rate<br />
Jan-14<br />
Jul-14<br />
Jan-15<br />
Jul-15<br />
Jan-16<br />
Jul-16<br />
23<br />
18<br />
13<br />
8<br />
30<br />
25<br />
20<br />
15<br />
10<br />
5<br />
0<br />
Jan-12<br />
Jul-12<br />
Jan-13<br />
Interest Rate Structure<br />
(percent)<br />
Time deposits (7-12 months)<br />
Central Bank rate<br />
Lending rate<br />
Jul-13<br />
Jan-14<br />
Jul-14<br />
Jan-15<br />
Jul-15<br />
Jan-16<br />
Jul-16<br />
30<br />
25<br />
20<br />
15<br />
10<br />
5<br />
0<br />
High excess reserves have recently<br />
begun to decline...<br />
…as increased repo sales helped to mop<br />
up structural excess liquidity.<br />
25<br />
20<br />
15<br />
10<br />
5<br />
0<br />
Commercial Bank Excess Reserves<br />
(percent of statutory reserves)<br />
Excess Reserves/Statutory Reserves<br />
25<br />
20<br />
15<br />
10<br />
5<br />
0<br />
1000<br />
900<br />
800<br />
700<br />
600<br />
500<br />
400<br />
300<br />
200<br />
100<br />
0<br />
Repo Sales<br />
(in local currency, billions)<br />
Repos Sold<br />
1000<br />
900<br />
800<br />
700<br />
600<br />
500<br />
400<br />
300<br />
200<br />
100<br />
0<br />
Jan-12<br />
Jul-12<br />
Jan-13<br />
Jul-13<br />
Jan-14<br />
Jul-14<br />
Jan-15<br />
Jul-15<br />
Jan-16<br />
Jul-16<br />
Nov-12<br />
May-13<br />
Nov-13<br />
May-14<br />
Nov-14<br />
May-15<br />
Nov-15<br />
May-16<br />
Sources: Bank of Uganda and IMF staff calculations.<br />
INTERNATIONAL MONETARY FUND 9
<strong>UGANDA</strong><br />
Figure 5. Uganda: Financial Sector Developments<br />
Overall, the banking sector remains well-capitalized.<br />
And the banking system’s liquidity ratio<br />
far exceeds the regulatory minimum.<br />
40<br />
35<br />
30<br />
25<br />
20<br />
Selected Financial Sector Indicators<br />
(percent)<br />
Regulatory capital to risk-weighted assets<br />
Regulatory tier 1 capital to risk-weighted assets<br />
Reg. capital target (12%)<br />
Reg. Tier 1 capital target (8%)<br />
40<br />
35<br />
30<br />
25<br />
20<br />
50<br />
40<br />
30<br />
Liquidity Ratio<br />
(percent)<br />
Liquid assets to total deposits<br />
Required liquid assets to total deposits<br />
50<br />
40<br />
30<br />
15<br />
15<br />
20<br />
20<br />
10<br />
10<br />
5<br />
5<br />
10<br />
10<br />
Jun-12<br />
Sep-12<br />
Dec-12<br />
Mar-13<br />
Jun-13<br />
Sep-13<br />
Dec-13<br />
Mar-14<br />
Jun-14<br />
Sep-14<br />
Dec-14<br />
Mar-15<br />
Jun-15<br />
Sep-15<br />
Dec-15<br />
Mar-16<br />
Jun-16<br />
Jun-12<br />
Sep-12<br />
Dec-12<br />
Mar-13<br />
Jun-13<br />
Sep-13<br />
Dec-13<br />
Mar-14<br />
Jun-14<br />
Sep-14<br />
Dec-14<br />
Mar-15<br />
Jun-15<br />
Sep-15<br />
Dec-15<br />
Mar-16<br />
Jun-16<br />
Profitability and earnings remained solid, but have declined<br />
recently…<br />
…mainly due to a sharp rise in<br />
nonperforming loans and provisioning<br />
costs.<br />
5<br />
4<br />
3<br />
Earnings and Profitability<br />
(percent)<br />
Return on assets<br />
Return on equity<br />
Net interest margin (RHS)<br />
50<br />
40<br />
30<br />
80<br />
60<br />
Selected Asset Quality Indicators<br />
(percent)<br />
10<br />
8<br />
2<br />
20<br />
40<br />
6<br />
1<br />
10<br />
20<br />
Specific provisions to NPLs<br />
4<br />
0<br />
Jun-12<br />
Dec-12<br />
Jun-13<br />
Dec-13<br />
Jun-14<br />
Dec-14<br />
Jun-15<br />
Dec-15<br />
Jun-16<br />
0<br />
0<br />
NPLs to total gross loans (RHS)<br />
Jun-12<br />
Sep-12<br />
Dec-12<br />
Mar-13<br />
Jun-13<br />
Sep-13<br />
Dec-13<br />
Mar-14<br />
Jun-14<br />
Sep-14<br />
Dec-14<br />
Mar-15<br />
Jun-15<br />
Sep-15<br />
Dec-15<br />
Mar-16<br />
Jun-16<br />
2<br />
Large exposures have risen over time, while insider lending<br />
is on a declining trend.<br />
5<br />
4<br />
3<br />
2<br />
1<br />
0<br />
Asset Quality: Large Exposures<br />
(percent)<br />
Insider loans to total<br />
capital (LHS)<br />
Large exposures to gross<br />
capital<br />
Jun-12<br />
Sep-12<br />
Dec-12<br />
Mar-13<br />
Jun-13<br />
Sep-13<br />
Dec-13<br />
Mar-14<br />
Jun-14<br />
Sep-14<br />
Dec-14<br />
Mar-15<br />
Jun-15<br />
Sep-15<br />
Dec-15<br />
Mar-16<br />
Jun-16<br />
150<br />
130<br />
110<br />
90<br />
70<br />
50<br />
30<br />
Rising NPLs were concentrated in agriculture, building and<br />
construction, trade and commerce, and transportation and<br />
communication.<br />
Sectoral Contribution to Total NPLs<br />
(percent)<br />
10<br />
9<br />
8<br />
7<br />
6<br />
5<br />
4<br />
3<br />
2<br />
1<br />
0<br />
Agriculture<br />
Building & construction<br />
Transport & communication<br />
Trade & commerce<br />
Other<br />
Jun-12<br />
Sep-12<br />
Dec-12<br />
Mar-13<br />
Jun-13<br />
Sep-13<br />
Dec-13<br />
Mar-14<br />
Jun-14<br />
Sep-14<br />
Dec-14<br />
Mar-15<br />
Jun-15<br />
Sep-15<br />
Dec-15<br />
Mar-16<br />
Jun-16<br />
10<br />
9<br />
8<br />
7<br />
6<br />
5<br />
4<br />
3<br />
2<br />
1<br />
0<br />
Sources: Bank of Uganda and IMF staff calculations.<br />
10 INTERNATIONAL MONETARY FUND
<strong>UGANDA</strong><br />
50<br />
40<br />
30<br />
20<br />
10<br />
0<br />
-10<br />
-20<br />
Figure 6. Uganda: Other Financial Sector Developments<br />
Shilling loans have stabilized, while<br />
foreign currency lending continues to<br />
contract.<br />
Evolution of Lending<br />
(percent, y-o-y growth)<br />
Jan-12<br />
Jul-12<br />
Jan-13<br />
Jul-13<br />
Jan-14<br />
Foreign currency loans (net of<br />
valuation effects)<br />
Shilling loans<br />
Jul-14<br />
Jan-15<br />
Jul-15<br />
Jan-16<br />
Jul-16<br />
50<br />
40<br />
30<br />
20<br />
10<br />
0<br />
-10<br />
-20<br />
50<br />
40<br />
30<br />
20<br />
10<br />
0<br />
-10<br />
-20<br />
Shilling deposits have recovered, while<br />
foreign currency deposits continue to<br />
decline.<br />
Evolution of Deposits<br />
(percent, y-o-y growth)<br />
Jan-12<br />
Jul-12<br />
Jan-13<br />
Jul-13<br />
Foreign currency deposits (net of<br />
valuation effects)<br />
Shilling deposits<br />
Jan-14<br />
Jul-14<br />
Jan-15<br />
Jul-15<br />
Jan-16<br />
Jul-16<br />
The decline in credit growth was concentrated in some of<br />
the same sectors that saw rising NPLs.<br />
Interest rate spreads increased during the tightening<br />
cycle,<br />
but have remained high despite the onset of easing.<br />
Contribution to Private Credit Growth<br />
(percent)<br />
Agriculture<br />
Other<br />
25<br />
Interest Rate Spreads<br />
(percent)<br />
25<br />
30<br />
25<br />
20<br />
Construction/ real estate<br />
Private consumption<br />
Total credit growth<br />
Trade<br />
Manufacturing<br />
30<br />
25<br />
20<br />
20<br />
15<br />
20<br />
15<br />
15<br />
10<br />
15<br />
10<br />
10<br />
10<br />
5<br />
5<br />
5<br />
5<br />
0<br />
-5<br />
Jun-14<br />
Sep-14<br />
Dec-14<br />
Mar-15<br />
Jun-15<br />
Sep-15<br />
Dec-15<br />
Mar-16<br />
Jun-16<br />
0<br />
-5<br />
0<br />
Shilling spread<br />
Forex spread<br />
Jun-12<br />
Sep-12<br />
Dec-12<br />
Mar-13<br />
Jun-13<br />
Sep-13<br />
Dec-13<br />
Mar-14<br />
Jun-14<br />
Sep-14<br />
Dec-14<br />
Mar-15<br />
Jun-15<br />
Sep-15<br />
Dec-15<br />
Mar-16<br />
Jun-16<br />
0<br />
100<br />
90<br />
80<br />
70<br />
60<br />
50<br />
The FX loans-to-deposit ratio has been stable, and<br />
persistently below the regulatory norm.<br />
Market Sensitivity<br />
(percent)<br />
Forex loans to forex deposits<br />
Reg. Norm for Forex loans to<br />
Forex deposits<br />
Jun-12<br />
Sep-12<br />
Dec-12<br />
Mar-13<br />
Jun-13<br />
Sep-13<br />
Dec-13<br />
Mar-14<br />
Jun-14<br />
Sep-14<br />
Dec-14<br />
Mar-15<br />
Jun-15<br />
Sep-15<br />
Dec-15<br />
Mar-16<br />
Jun-16<br />
100<br />
90<br />
80<br />
70<br />
60<br />
50<br />
The declining trend in FX exposure to regulatory tier 1<br />
capital suggests that the system is structurally short.<br />
4<br />
2<br />
0<br />
-2<br />
-4<br />
-6<br />
-8<br />
-10<br />
Market Sensitivity<br />
(percent)<br />
Forex exposure to regulatory tier 1 capital<br />
Linear (Forex exposure to regulatory tier 1 capital)<br />
Jun-12<br />
Sep-12<br />
Dec-12<br />
Mar-13<br />
Jun-13<br />
Sep-13<br />
Dec-13<br />
Mar-14<br />
Jun-14<br />
Sep-14<br />
Dec-14<br />
Mar-15<br />
Jun-15<br />
Sep-15<br />
Dec-15<br />
Mar-16<br />
Jun-16<br />
4<br />
2<br />
0<br />
-2<br />
-4<br />
-6<br />
-8<br />
-10<br />
Sources: Bank of Uganda and IMF staff calculations.<br />
INTERNATIONAL MONETARY FUND 11
<strong>UGANDA</strong><br />
PERFORMANCE UNDER THE PSI<br />
6. Performance under the PSI through end-June 2016 was mixed (Memorandum of<br />
Economic and Financial Policies (MEFP), para. 11-18). The BoU kept core inflation inside its inflation<br />
target band. Softer growth and election effects led to the non-observances of fiscal targets, though it is<br />
important to note that these were more muted than during the previous presidential elections.<br />
Structural reforms progressed, albeit with many delays.<br />
7. The BoU kept inflation within the target band and exceeded its reserve accumulation<br />
target at end-June (MEFP Table 1.1). Tight monetary policy through April 2016 helped contain core<br />
inflation within the BoU’s target range. Core inflation decelerated to 5.1 percent year-on-year in<br />
October from its peak of 7.5 percent in December 2015, remaining well within the inner band of the<br />
inflation consultation clause at end-June. In the same period, headline inflation decelerated to<br />
4.1 percent year-on-year from its peak of 8.4 percent. The BoU seized the favorable balance of<br />
payments developments and accumulated about US$170 million gross international reserves to<br />
US$2.96 billion (about 4½ months of next year’s imports), exceeding the end-June target.<br />
8. Most fiscal targets were missed due to a confluence of temporary factors (MEFP Table<br />
1.1). The authorities met the targets on the zero ceiling of external payment arrears and on the deposit<br />
of oil revenues in the Petroleum Fund. They also protected poverty-alleviating spending, meeting their<br />
FY15/16 program objective. However, tax revenue fell short of target by 0.3 percent of GDP, reflecting<br />
lower nominal growth. In addition, higher than anticipated<br />
election-related spending led to an overrun of current expenditure of 0.1 percent of GDP. Thus, the<br />
program fiscal deficit target (QAC) was missed by 0.5 percent of GDP, and the government partly relied<br />
on BoU advances for its financing needs. 2 Staff supports a waiver on the basis that the<br />
non-observance was temporary. Externally-financed development spending (including hydro power<br />
projects) was under-executed by 2.4 percent of GDP, and the overall fiscal deficit was 1.2 percent of<br />
GDP lower than anticipated, partly because the necessary domestic contribution was not budgeted for.<br />
While the authorities have cleared domestic arrears of about 0.1 percent of GDP in FY16/17 so far, they<br />
are still reconciling estimates of the stock, which has complicated assessment of the associated<br />
indicative target. The preliminary estimates put the stock of domestic arrears as of June 2016 at<br />
3.2 percent of GDP.<br />
9. Structural reforms have progressed, with two out of five completed on time<br />
(MEFP Table 1.2). The government has issued regulations for implementing the PFM Act, though<br />
some key elements (e.g., the management of oil revenues) have not been incorporated and are partly<br />
expected to be covered in the corresponding instructions under preparation. The government also sent<br />
the charter of fiscal responsibility to Parliament. The charter includes measurable fiscal objectives to<br />
guide Uganda’s fiscal framework and strong commitments to transparency, though it could have<br />
usefully included a requirement to explain how deviations from the measurable objectives will be<br />
2<br />
BoU advances are intended only for within-year cash flow management.<br />
12 INTERNATIONAL MONETARY FUND
<strong>UGANDA</strong><br />
corrected. There have been delays in the publication of quarterly reports on unpaid bills and domestic<br />
arrears. The publication of reconciled reports on the stock of domestic arrears for June 2015 and<br />
June 2016 has been rescheduled to December 2016 to allow sufficient time for the authorities to<br />
validate the data. The authorities will no longer be able to publish a reconciled report on the stock of<br />
unpaid bills for December 2015 as this interim data is superseded by the end-fiscal year report.<br />
Similarly, a delay occurred in the passage of the amended Anti-Money Laundering (AML) Bill and the<br />
Insurance Regulatory Bill, intended to help ensure Uganda’s prompt exit of the Financial Action Task<br />
Force (FATF) “gray list.” There was also a delay in the approval of the Amendments to the BoU Act,<br />
designed to enhance the legislative framework for strengthening BoU’s capital and operational<br />
independence.<br />
POLICY DISCUSSIONS<br />
10. With the elections over, the authorities aim to refocus macroeconomic policies on their<br />
medium-term objectives. Fiscal policy will emphasize improving the quality of spending and<br />
continued increases in domestic revenues to create space for the scaled up infrastructure drive and<br />
preserve debt sustainability. Monetary policy has scope for further easing, if the favorable inflation<br />
forecast remains in place. The authorities will also push ahead with their structural reform agenda,<br />
though some measures may take more time than initially hoped for. The medium-term growth outlook<br />
remains favorable. The authorities expect growth to reach 6½ percent over the<br />
medium-term, as infrastructure bottlenecks are eased and more investments for oil production<br />
commence. After some delays, oil production licenses have now been awarded, and the pipeline route<br />
through Tanzania has been agreed on.<br />
11. While the baseline outlook is favorable, risks are tilted to the downside. As other<br />
countries, Uganda remains exposed to risks from lower global growth and trade as well as tighter<br />
global financing conditions. Negative spillovers from the conflict in South Sudan could further weigh<br />
on exports and growth, while the growing refugee influx could entail budget pressures. Rainfalls have<br />
been late this year, and an unfolding drought could adversely affect food security and add to fiscal<br />
pressures. There also appears to be a negative sentiment in the private sector that is not yet captured<br />
in the headline numbers, but may forewarn of a potential deterioration in economic conditions.<br />
A. Fiscal Policy<br />
12. The authorities aim for a slightly tighter fiscal stance in FY16/17 compared with the<br />
sixth review and their budget to ensure Uganda remains at low risk of debt distress—the<br />
cornerstone of the program—and minimize crowding out of the private sector. They target the<br />
overall deficit to widen by ¾ percentage points to 6 percent of GDP (¼ percentage point lower than<br />
envisaged in the sixth review). The authorities have taken tax policy and administration<br />
INTERNATIONAL MONETARY FUND 13
<strong>UGANDA</strong><br />
measures to increase revenue collection by ½ percent of GDP. 3 However, the budget is under pressure<br />
from three directions: (i) revenue collection could be lower in shilling terms, reflecting the downward<br />
revision of nominal growth; (ii) the authorities had underestimated debt service by about 0.2 percent<br />
of GDP, which they intend to accommodate within the existing envelope; (iii) and the authorities do<br />
not want to significantly increase their reliance on bank financing, with private sector credit growth<br />
already near zero. Staff acknowledges the authorities’ ambition, but cautions that this will require strict<br />
expenditure control which may be difficult to achieve, given that about 55 percent of the budget has<br />
been released in Q1 and Q2. There is, thus, a risk that the government could miss its deficit target. In<br />
this case, they may have to consider additional domestic financing to avoid relying on BoU advances<br />
again.<br />
13. The authorities’ financing strategy is guided by the objective to limit reliance on<br />
domestic bank financing. The government will utilize a US$200 million non-concessional loan to<br />
replace World Bank budget support and repay the outstanding BoU advances from FY15/16. 4 The<br />
Bank’s budget support has been affected by the decision to withhold new lending to Uganda to<br />
address performance issues in the portfolio, and the authorities are engaging closely with the Bank to<br />
address these concerns, including by improving social safeguards and project supervision (MEFP, para.<br />
34). The authorities remain committed to using BoU advances only for cash-flow management. Taken<br />
together, the authorities expect to reduce their reliance on bank financing compared with last year and<br />
thus facilitate a recovery in private sector credit.<br />
14. The authorities are stepping up efforts to reduce domestic arrears. They have reported<br />
preliminary data on the stock of domestic arrears as of June 2016 and committed to provide fully<br />
reconciled data by December 2016 after completing an ongoing internal reconciliation exercise. In<br />
addition, they have made a specific front-loaded allocation for domestic arrears clearance in FY16/17<br />
and additional allocations in their medium-term budget framework, and issued guidance to provide<br />
arrears repayment the first call on budgetary resources. Furthermore, they have requested technical<br />
assistance from AFRITAC East to improve expenditure commitment controls and prevent future<br />
domestic arrears.<br />
B. Monetary Policy and Financial Stability<br />
15. With a favorable inflation outlook, the BoU has entered an easing cycle since April. The<br />
Monetary Policy Committee reduced the central bank rate (CBR) by 100 basis points to 13 percent in<br />
its last meeting in October, resulting in a cumulative reduction of 400 basis points since April (Figure<br />
4). While treasury bill rates have continued to decline across all tenors since the elections, the<br />
reduction in the CBR has been slow to transmit to lending rates, possibly reflecting a tightening of<br />
lending standards and the asymmetry in transmission of monetary policy.<br />
3<br />
These include raising excises on fuel, motor vehicle lubricants, and other products, and improving compliance through<br />
intensifying audit and research on medium and large taxpayers. In percent of GDP, revenue is lower than expected in<br />
the sixth review, mainly reflecting the below-target collection in the previous fiscal year.<br />
4<br />
The loan is provided by the Eastern and Southern African Trade and Development Bank, referred to as the PTA Bank.<br />
14 INTERNATIONAL MONETARY FUND
<strong>UGANDA</strong><br />
16. The scope for further monetary policy easing is guided by the BoU’s inflation forecast.<br />
The BoU considers that food prices are subject to considerable risks from unfavorable weather, while<br />
Shilling depreciation could also pose inflation risks. The scope for further easing of monetary policy<br />
also depends on fiscal policy implementation. The BoU’s inflation model—which has been developed<br />
with Fund support—projects core inflation to converge to its target. Staff agrees that the BoU may<br />
have further space to ease monetary policy, if the inflation outlook remains benign, and concurs with<br />
their risk assessment.<br />
17. The BoU appropriately took over management of the third largest domestic bank. The<br />
Crane Bank had become undercapitalized when it had to recognize underreported NPLs earlier this<br />
year. Facing a steady deposit outflow, the bank was close to being illiquid, and there were signs of<br />
asset stripping. Deposit outflows have reportedly stopped, and the authorities aim to find a strategic<br />
investor. Staff welcomes these steps, but cautions that the authorities should also consider<br />
contingency plans.<br />
18. The remaining banking system is, in general, well-capitalized, but rising NPLs have<br />
constrained private sector credit. Most banks already meet the increased Basel III capital<br />
requirements, and the BoU’s top-down stress tests point to the sector’s resilience. 5 However, NPLs rose<br />
to 8.3 percent in June 2016 from 4 percent a year ago, ascribed to the slowdown of economic activities<br />
and government domestic arrears. NPLs declined to 7.7 percent in September based on preliminary<br />
figures. Some smaller banks struggle with profitability and have been subject to social media rumors.<br />
Heightened credit risk and elevated provisioning costs have prompted a tightening of lending<br />
standards. The government’s recent efforts in clearing domestic arrears is expected to reduce NPLs<br />
and improve private sector credit conditions (MEFP, para. 7).<br />
19. The BoU continues to strengthen prudential oversight. To address potential vulnerabilities<br />
in real estate lending, the BoU implemented a new cap on the loan-to-value ratio in May 2016. In<br />
addition, to mitigate risks around mobile money, the BoU has commissioned an international firm to<br />
study the industry and provide recommendations for strengthening supervision. Furthermore, the BoU<br />
collaborated with other central banks to conduct regional stress tests and assessed the cross-border<br />
operations of banks with a regional presence. Finally, to enhance the supervision of nonbanks,<br />
Parliament approved the Tier IV Microfinance Institutions Act in July 2016, which supports the<br />
establishment of a Microfinance Regulatory Authority to complement the BoU in supervising the<br />
sector.<br />
5<br />
All banks will be required to have a capital conservation buffer (CCB) of 2.5 percent of risk-weighted assets (RWA)<br />
above the minimum capital requirements; all Domestic Systemically Important Banks will be required to have additional<br />
capital of between 1-3.5 percent of RWA above the minimum capital requirements and CCB.<br />
INTERNATIONAL MONETARY FUND 15
<strong>UGANDA</strong><br />
20. The authorities are addressing deficiencies in Anti-Money Laundering and Combating<br />
the Financing of Terrorism (AML/CFT) to secure Uganda’s swift exit from the FATF “gray list.”<br />
Building on an earlier action plan to improve Uganda’s AML/CFT regime, the authorities have included<br />
additional measures to address the deficiencies identified in a 2016 Mutual Evaluation Report by the<br />
Eastern and Southern Africa AML Group. These measures include, among others: (a) adequately<br />
criminalizing the financing of terrorism; (b) expanding the scope of record-keeping requirements to all<br />
financial institutions; and (c) designating supervisory bodies with necessary powers to enforce<br />
compliance, including proportionate and dissuasive sanctions. The authorities expect to take the key<br />
legal steps by December 2016 (structural benchmark (SB)).<br />
21. The authorities acknowledged the delays with the proposed Amendments to the BoU<br />
Act. Discussions between the Ministry of Finance and the BoU are advanced, and should be concluded<br />
soon. With that, the authorities expect to submit the amendments to the Act to parliament by end-<br />
March 2017. Staff regrets the delays and encourages the authorities to follow international best<br />
practices in the outstanding areas.<br />
C. Financial Sector Development and Inclusion<br />
22. The authorities have continued reforms to deepen financial markets. The authoriies are<br />
reviewing which banks should be allowed to act as primary dealers, since not all current primary<br />
dealers are delivering on their responsbiliities which affects the functioning of the secondary market. In<br />
parallel, the BoU is developing a master repo agreement to facilitate a deepening of the interbank<br />
market.<br />
23. The authorities are pursuing financial inclusion through several fronts. Passage of the<br />
Amended Financial Institutions Act in 2016 allows for Agency Banking, bancassurance, and Islamic<br />
banking, which enhances financial inclusion by greatly expanding the network of service providers. The<br />
regulations for Agency Banking are expected to be approved by the Ministry of Finance later this year;<br />
the draft regulations for bancassurance have been shared with the industry for review; and the draft<br />
regulations for Islamic Banking are under review with support from the Islamic Development Bank. The<br />
mobile banking industry continues its expansion, with over 21 million registered users. Building on<br />
the 2013 Mobile Money Guidelines, a comprehensive regulatory framework is under preparation to<br />
safeguard this important part of the financial market (proposed new SB).<br />
24. The BoU is also strengthening consumer protection. BoU has continued to enforce<br />
through annual onsite inspections the financial protection guidelines to protect consumers while also<br />
promoting financial literacy programs. Banks are required to issue key financial facts to consumers for<br />
all loan products at their inception and whenever there are changes in the contractual terms.<br />
16 INTERNATIONAL MONETARY FUND
<strong>UGANDA</strong><br />
D. Debt Sustainability<br />
25. The authorities are committed to ensuring that their debt remains at low risk of debt<br />
distress. The Debt Sustainability Analysis (DSA, Annex 2) continues to show a low risk of debt distress,<br />
but also indicates that vulnerabilities have increased. The authorities acknowledged the vulnerability to<br />
export shocks and the importance of realizing the envisaged growth dividend. They expected the level<br />
and resilience of exports to improve over time, supported by infrastructure investment and regional<br />
integration.<br />
26. Further progress on domestic revenue<br />
mobilization is key to maintaining Uganda’s<br />
favorable risk rating. The authorities recognize<br />
that Uganda’s tax revenue significantly<br />
underperforms compared to regional peers and<br />
are committed to increasing tax revenue by at<br />
least ½ percentage point of GDP per year. They<br />
remain focused on revenue administration reforms<br />
to boost tax collection. 6 In addition, the authorities<br />
have requested FAD technical assistance on tax<br />
policy to assess priority areas for further reforms.<br />
Staff welcomes these efforts and suggests that the<br />
authorities also monitor tax expenditures and their<br />
effectiveness.<br />
18<br />
16<br />
14<br />
12<br />
10<br />
Tax revenues*<br />
(percent of GDP)<br />
Uganda Tanzania Burundi<br />
Rwanda Ethiopia Kenya<br />
8<br />
FY10/11 FY11/12 FY12/13 FY13/14 FY14/15 FY15/16<br />
* Refer to FY data or calculated equivalents.<br />
18<br />
16<br />
14<br />
12<br />
10<br />
8<br />
27. Likewise, enhancing the efficiency of public investment is key to realizing the growth<br />
dividend which underpins debt sustainability. The authorities are concerned about persistent<br />
investment under-execution and will continue with reforms to strengthen public investment<br />
management, in particular, requiring more rigorous feasibility studies and ensuring that the required<br />
budget allocations for counterparty funding are made before loans are contracted. They aim to finalize<br />
an Appraisal User Manual by December and make it mandatory for all new projects (structural<br />
benchmark). They have requested FAD technical assistance to help set reform priorities in public<br />
investment management going forward.<br />
28. Safeguarding debt sustainability also requires better debt monitoring and management,<br />
including fiscal risks from extra-budgetary units and Public-Private Partnerships (PPPs). The<br />
authorities recognize that the increasing use of PPPs requires improved monitoring and management.<br />
While a PPP unit has been created at the Ministry of Finance, sufficient resources are yet to be<br />
provided. The authorities are also establishing a system for monitoring borrowing by government<br />
agencies and state-owned enterprises. Staff welcomes these efforts and encourages the authorities to<br />
make use of technical assistance from the Fund or development partners in this area.<br />
6<br />
A 2014 FAD report on Value-Added Tax finds that improving compliance and achieving the regional average tax<br />
efficiency can help Uganda collect about 2–2½ percent of GDP at that time.<br />
INTERNATIONAL MONETARY FUND 17
<strong>UGANDA</strong><br />
E. Program Design<br />
29. The authorities propose changes to their program, given developments in FY15/16 and<br />
the more muted economic outlook. The overall program objectives, in particular raising the revenue<br />
yield by ½ percent of GDP remain in place. However, reflecting base effects from FY15/16 and lower<br />
nominal growth as well as concerns over balance of payments inflows, the authorities propose to<br />
adjust two QACs (the ceiling on the overall deficit and the minimum accumulation of international<br />
reserves) and a few indicative targets for the remainder of the program period (MEFP Table 1.1). They<br />
also propose to reschedule those SBs for which they will require more time (MEFP Table 1.2).<br />
30. In addition, the authorities propose four new SBs, including those on AML/CFT and<br />
public financial management (MEFP Table 1.2):<br />
<br />
<br />
<br />
<br />
Ministry of Finance to further strengthen the AML/CFT framework in line with the international<br />
standard by liaising with Parliament to amend the Anti-Terrorism Act to adequately criminalize<br />
the financing of terrorism (SB, end-December 2016).<br />
Ministry of Finance to establish a framework for following up and reporting on the<br />
implementation of the recommendations of value-for-money audits conducted by the Auditor<br />
General’s office (SB, end-March 2017).<br />
Ministry of Finance to produce a manual setting out national parameters, shadow prices, and<br />
conversion factors to be used in all economic project appraisals prior to admission into the<br />
Public Investment Plan (SB, end-March 2017).<br />
Ministry of Finance and BoU to prepare and submit to Cabinet a policy to regulate mobile<br />
money banking (SB, end-April 2017).<br />
STAFF APPRAISAL<br />
31. The Ugandan authorities have managed well in a difficult election year. Fiscal slippages<br />
were contained compared with the 2011 election, and inflation was kept close to target. However,<br />
growth at 5 percent—2 percent in per-capita terms—falls short of past performance and aspirations<br />
and seems insufficient to shake an undercurrent of negative sentiment. The scaling up of infrastructure<br />
investment is intended to address growth bottlenecks, and will be most effective if combined with<br />
investments in human capital and improvements in the business environment. Staff commends<br />
Uganda for hosting refugees from neighboring countries and allowing them the opportunity to be<br />
economically active. The international community is called upon to provide financial assistance to<br />
mitigate the humanitarian crisis and support this integration model.<br />
32. Staff notes the mixed performance under the authorities’ program through June 2016.<br />
Stable inflation and the build-up of international reserves are welcome, as is the protection of povertyalleviating<br />
expenditures. The fiscal slippages were contained, and partly reflect lower nominal growth.<br />
However, expenditure composition has deteriorated, as externally financed development spending fell<br />
short of expectations and current, less productive expenditure increased. This points to weaknesses in<br />
the budget and public investment management processes that undermine the intended scaling up of<br />
infrastructure investment. The authorities met SBs aimed at improving public financial management<br />
18 INTERNATIONAL MONETARY FUND
<strong>UGANDA</strong><br />
and fiscal transparency, but other important initiatives were delayed. Staff supports the modification of<br />
QACs to update the authorities’ current program, the rescheduling of the dates for a few existing SBs,<br />
and the addition of the proposed new SBs in program monitoring.<br />
33. Staff welcomes the authorities’ FY16/17 policy objectives. The inflation outlook has<br />
allowed monetary easing and remains benign, with the exchange rate and drought-related food price<br />
spikes being the main risks. Fiscal policy stays the course on increasing the revenue take by ½ percent<br />
of GDP, while seeking to contain expenditures within a tight ceiling. Achieving this expenditure<br />
restraint will be difficult, not least because line ministries have not always properly budgeted for the<br />
domestic component of development spending. Staff encourages the authorities to finalize reporting<br />
of domestic government arrears and follow through on plans to hold accounting officers responsible<br />
for arrears avoidance. Staff cautions that new policy proposals, however well-intended, need to be<br />
accommodated in a way that would not undermine revenue mobilization and debt sustainability.<br />
34. The BoU appropriately intervened in a systemically important domestic bank. The search<br />
for a strategic investor has begun, and the BoU should in parallel consider contingency plans. A review<br />
of the episode could be useful to assess what potential lessons could be drawn for bank supervision.<br />
The implementation of Basel III capital standards and tightening of macro-prudential standards should<br />
enhance the resilience of the sector.<br />
35. The authorities are cooperating closely with FATF to ensure a swift exit from the “gray<br />
list.” The necessary legal changes to the Anti-Terrorism Act, the AML Law, and the Insurance Act are<br />
under way, but completing them on the timeline agreed with FATF will require deep engagement with<br />
parliament. Staff also calls on the authorities to submit the amendments to the BoU Act to parliament<br />
which will strengthen the central bank’s ability to deliver on its mandate.<br />
36. The DSA update underscores the importance of further raising the revenue-to-GDP<br />
ratio and ensuring that public investment yields the intended growth dividend. Uganda remains<br />
at low risk of debt distress, and public debt would stabilize at about 42 percent of GDP after the<br />
current investment scaling-up is completed. However, the DSA shock scenarios indicate increased<br />
vulnerabilities compared with the previous update. The government could consider a more ambitious<br />
path of domestic revenue mobilization to mitigate these vulnerabilities. In parallel, strengthening<br />
public investment management will be instrumental to ensuring that projects are properly prepared,<br />
vetted, consistent with policy priorities, and executed efficiently to yield maximum value for money.<br />
Staff encourages the authorities to speed up reforms in this area.<br />
37. Staff recommends completion of the seventh review of the PSI-supported program. The<br />
attached MEFP outlines the macroeconomic objectives and policies for the remainder of the program<br />
period. Staff supports a waiver of the nonobservance of the ceiling on the overall deficit of the central<br />
government on the grounds that the non-observance was temporary.<br />
INTERNATIONAL MONETARY FUND 19
<strong>UGANDA</strong><br />
Table 1. Uganda: Selected Economic and Financial Indicators, FY2012/13–2020/21 1,2<br />
2012/13 2013/14 2014/15 2015/16 2016/17<br />
6th Rev Est. 6th Rev Proj.<br />
2017/18 2018/19 2019/20 2020/21<br />
Proj.<br />
(Annual percentage change, unless otherwise indicated)<br />
Output, prices, and exchange rate<br />
Real GDP 2.7 5.2 5.1 5.0 4.8 5.5 5.0 5.5 6.0 6.3 6.5<br />
GDP deflator 6.1 3.4 5.1 7.6 4.0 4.4 5.1 4.7 4.8 4.8 3.8<br />
CPI (period average) 5.0 5.2 3.0 7.3 6.6 5.5 5.4 4.8 4.9 5.0 5.0<br />
Core inflation (period average) 6.6 4.6 3.3 6.8 6.7 5.1 4.8 4.6 4.8 5.0 5.0<br />
Terms of trade ("–" = deterioration) -8.2 4.7 18.8 2.5 5.0 -2.8 -0.3 -1.3 -1.0 -1.1 -0.9<br />
Exchange Rate (Ugandan Shilling/US$) 1.3 -2.0 11.4 … 21.8 … … … … … …<br />
Real effective exchange rate ("–" = depreciation) 3.3 7.8 -3.7 … -7.2 … … … … … …<br />
Money and credit<br />
Broad money (M3) 6.6 17.4 15.9 15.5 7.1 12.9 5.8 17.4 13.0 18.9 15.8<br />
Credit to non-government sector 6.4 13.9 20.4 16.2 4.0 16.2 8.3 15.0 15.5 16.0 16.5<br />
Bank of Uganda policy rate 3 11.0 11.0 13.0 … 15.0 … … … … … …<br />
M3/GDP (percent) 18.6 20.1 21.1 22.5 20.7 23.0 19.8 21.1 21.5 22.9 24.0<br />
NPLs (percent of total loans) 4.0 5.8 4.0 … 8.3 … … … … … …<br />
(Percent of GDP, unless otherwise indicated)<br />
Central government budget<br />
Revenue and grants 12.7 12.6 14.2 15.7 14.9 16.2 15.9 15.9 16.1 16.2 16.5<br />
Of which : grants 1.4 1.0 1.2 1.7 1.4 1.8 1.8 1.4 1.2 0.7 0.6<br />
Expenditure 16.2 16.6 18.5 22.1 19.7 22.5 21.9 20.8 20.1 19.1 19.3<br />
Current 9.0 9.5 9.9 10.7 10.8 10.4 10.4 10.3 10.3 10.3 10.1<br />
Capital 4 6.5 7.0 8.0 11.0 8.5 11.3 11.0 10.3 9.7 8.7 9.1<br />
Primary balance -2.1 -2.6 -2.7 -4.4 -2.8 -4.1 -3.6 -2.3 -1.2 -0.2 -0.2<br />
Overall balance -3.2 -3.5 -4.4 -6.4 -5.2 -6.2 -6.0 -4.9 -4.0 -2.9 -2.7<br />
Excluding grants -4.7 -4.5 -5.6 -8.1 -6.5 -8.1 -7.8 -6.2 -5.2 -3.6 -3.3<br />
Of which: Net domestic borrowing 1.0 2.2 3.2 1.6 2.2 0.9 0.7 1.0 0.3 0.0 0.6<br />
Public debt<br />
Public gross debt 25.9 28.3 31.8 36.9 34.5 40.5 38.6 41.5 41.4 40.9 41.1<br />
External 15.0 15.8 18.5 23.2 20.9 27.1 25.0 28.1 29.1 29.9 30.5<br />
Domestic 10.9 12.5 13.3 13.8 13.7 13.5 13.7 13.4 12.3 11.1 10.6<br />
Investment and savings<br />
Investment 27.8 26.7 24.3 27.5 24.7 28.8 27.8 29.1 30.7 30.7 31.5<br />
Public 6.5 7.0 8.0 8.9 8.5 9.2 11.0 10.3 9.7 8.7 9.1<br />
Private 21.3 19.7 16.3 18.6 16.2 19.6 16.8 18.8 21.0 22.1 22.4<br />
Savings 21.2 18.8 16.8 17.3 18.4 17.9 20.4 20.6 21.1 21.6 22.3<br />
Public 1.7 2.3 2.9 1.7 2.8 2.1 3.6 4.5 5.0 5.5 6.0<br />
Private 19.6 16.5 14.0 15.7 15.7 15.7 16.7 16.1 16.1 16.1 16.3<br />
External sector<br />
Current account balance (including grants) -6.3 -7.6 -7.2 -9.7 -5.9 -10.7 -7.1 -8.2 -8.8 -8.9 -8.8<br />
Current account balance (excluding grants) -6.6 -7.9 -7.5 -10.1 -6.3 -11.0 -7.4 -8.5 -9.6 -9.1 -9.2<br />
Exports (goods and services) 20.2 18.2 18.1 20.4 18.2 19.4 19.0 19.5 20.5 21.2 21.9<br />
Imports (goods and services) 30.3 27.9 28.8 32.0 28.6 31.5 29.5 30.0 31.2 31.2 32.0<br />
Gross international reserves<br />
In billions of US$ 2.9 3.4 2.9 2.7 3.0 2.9 3.0 3.1 3.5 3.9 4.4<br />
In months of next year's imports of goods<br />
and services 4.5 5.1 4.9 3.9 4.6 4.0 4.2 4.0 4.1 4.2 4.5<br />
Memorandum items:<br />
GDP at current market prices<br />
Ush. Billion 64,758 70,458 77,845 84,306 84,907 92,878 93,639 103,400 114,880 127,947 141,375<br />
US$ million 24,993 27,761 27,531 … 24,661 … … … … … …<br />
GDP per capita (Nominal US$) 665 717 690 592 600 632 626 648 672 718 742<br />
Population (million) 37.6 38.7 39.9 … 41.1 … … … … … …<br />
Share of population below poverty line (percent) 19.7 … … … … … … … … … …<br />
Sources: Ugandan authorities and IMF staff estimates and projections.<br />
1 Fiscal year runs from July 1 to June 30.<br />
2 All figures are based on the 2009/10 rebased GDP provided by the authorities in October 2016.<br />
3 The CBR was introduced following the start of Inflation Targeting in July 2011. Data refer to end-year CBRs.<br />
4 Capital expenditures include net lending and investment on hydropower projects, and excludes BoU recapitalization and other spending.<br />
20 INTERNATIONAL MONETARY FUND
<strong>UGANDA</strong><br />
Table 2a. Uganda: Fiscal Operations of the Central Government, FY2012/13–2017/18 1,2<br />
(Billions of Ugandan Shillings)<br />
/<br />
2012/13 2013/14 2014/15 2015/16<br />
2016/17 7 2017/18<br />
6th Rev Est. Budget 6th Rev Staff Proj.<br />
Total revenue and grants 8,245 8,868 11,045 13,208 12,647 14,699 15,071 14,868 16,451<br />
Revenue 7,309 8,165 10,114 11,747 11,500 12,914 13,386 13,150 15,052<br />
Tax 7,005 7,831 9,542 11,040 10,833 … 12,585 12,424 14,304<br />
International trade taxes 599 747 838 1,120 1,076 … 1,319 1,267 1,608<br />
Income taxes 2,588 2,756 3,402 3,840 3,872 … 4,316 4,370 4,912<br />
Excises 1,466 1,757 2,128 2,490 2,300 … 2,963 2,767 3,258<br />
Value-added tax 2,353 2,570 3,117 3,518 3,522 … 3,902 3,950 4,428<br />
Infrastructure levy … … 57 72 63 … 85 69 98<br />
Nontax 304 334 452 582 545 … 674 597 748<br />
Oil revenue 0 0 120 125 121 132 127 128 0<br />
Grants 936 702 931 1,460 1,147 1,785 1,685 1,718 1,399<br />
Budget support 3 199 191 258 334 340 … 292 282 287<br />
Project grants 738 511 673 1,127 808 … 1,393 1,436 1,112<br />
Expenditures and net lending 4 10,523 11,684 14,379 18,590 16,727 20,793 20,875 20,464 21,483<br />
Current expenditures 5,813 6,706 7,689 8,996 9,169 9,600 9,656 9,710 10,623<br />
Wages and salaries 2,160 2,385 2,759 2,989 2,966 … 3,307 3,359 3,549<br />
Interest payments 890 970 1,213 1,692 1,682 … 2,002 2,188 2,703<br />
Other current 2,763 3,351 3,717 4,314 4,520 … 4,347 4,163 4,371<br />
Development expenditures 4,237 4,937 5,230 7,017 5,907 9,226 9,087 9,054 9,285<br />
Externally-financed projects 2,163 1,871 1,933 3,489 2,384 … 4,705 4,804 4,568<br />
Of which: Non-concessional borrowing 1,047 202 … 925 870 1,928<br />
Government of Uganda investment 2,074 3,066 3,296 3,528 3,523 … 4,382 4,250 4,716<br />
Net lending and investment 409 21 1,235 2,497 1,532 1,605 1,782 1,539 1,415<br />
Hydro-power projects 0 21 985 2,297 1,332 … 1,432 1,239 1,315<br />
Of which: Non-concessional borrowing 0 0 0 1,994 1,074 … 1,432 1,223 1,315<br />
Recapitalization 410 0 250 200 -37 … 350 300 100<br />
Of which: Bank of Uganda 5 410 0 250 200 -37 … 350 100 100<br />
Other spending 63 20 225 80 119 362 350 161 160<br />
Clearance of domestic arrears 63 20 225 80 119 … 110 161 160<br />
Contingency 0 0 0 0 0 … 240 0 0<br />
Float -193 -352 68 0 313 0 0 0 0<br />
Overall balance -2,084 -2,463 -3,402 -5,382 -4,393 -6,094 -5,804 -5,596 -5,031<br />
Underlying balance (excl. one-off spending) 6 -1,675 -2,443 -2,287 -1,963 -2,780 -4,621 -3,224 -3,315 -1,688<br />
Financing 2,084 2,463 3,402 5,382 4,393 6,094 5,804 5,596 5,031<br />
External financing (net) 1,418 887 919 4,017 2,494 5,497 4,969 4,920 4,000<br />
Disbursement 1,628 1,128 1,177 4,356 2,814 … 5,352 5,297 4,771<br />
Budget support 324 0 0 0 0 … 261 0 0<br />
Concessional project loans 1,303 1,128 1,177 1,315 1,537 … 2,387 2,497 1,528<br />
Non-concessional borrowing 0 0 0 3,041 1,276 … 2,357 2,093 3,243<br />
Revolving Credit … 347 707 0<br />
Amortization (–) -200 -212 -254 -339 -320 … -388 -373 -776<br />
Exceptional financing -10 -30 -4 0 0 … 5 -4 6<br />
Domestic financing (net) 666 1,576 2,483 1,365 1,899 596 835 676 1,031<br />
Bank financing 508 647 1,288 765 923 … 503 220 513<br />
Bank of Uganda 7 -77 -198 1,064 265 309 … 223 -236 100<br />
Commercial banks 585 845 224 500 614 305 280 456 413<br />
Nonbank financing 158 930 1,195 600 976 306 332 456 518<br />
Memorandum Items:<br />
Petroleum Fund (end-period stock) 8 1,606 1,608 120 245 241 … 372 369 369<br />
Energy fund (end-period stock) 775 748 190 0 0 … 0 0 0<br />
Expenditures for poverty-alleviating sectors 2,448 2,841 3,032 3,032 3,241 … 3,547 3,547 4,151<br />
Sources: Ugandan authorities and IMF staff estimates and projections.<br />
1<br />
Fiscal year runs from July 1 to June 30.<br />
2<br />
All figures are based on the 2009/10 rebased GDP provided by the authorities in October 2016.<br />
3<br />
Include mainly HIPC-related grants from FY 2013/14 onwards.<br />
4<br />
Expenditure categories in FY2013/14 include clearance of arrears totaling Shs. 544 billion, mainly in Government of Uganda investment and other current<br />
spending.<br />
5<br />
Reflects actual and projected issuances for the recapitalization of Bank of Uganda.<br />
6<br />
The overall deficit excluding large infrastructure projects financed by nonconcessional external borrowing (e.g. HPPs), BOU recapitalization, and oil<br />
revenue.<br />
7<br />
Net financing from the Bank of Uganda includes resources freed by MDRI relief.<br />
8<br />
The balances of the Oil Fund were transferred to the UCF and in line with the PFM Act, a new Petroleum Fund was opened with balances from<br />
recent oil revenue deposits.<br />
INTERNATIONAL MONETARY FUND 21
<strong>UGANDA</strong><br />
Table 2b. Uganda: Fiscal Operations of the Central Government, FY2012/13–2017/18 1,2<br />
(Percent of GDP)<br />
2012/13 2013/14 2014/15 2015/16<br />
2016/17<br />
2017/18<br />
6th Rev Est. Budget 6th Rev Staff Proj.<br />
Total revenue and grants 12.7 12.6 14.2 15.7 14.9 15.7 16.2 15.9 15.9<br />
Revenue 11.3 11.6 13.0 13.9 13.5 13.8 14.4 14.0 14.6<br />
Tax 10.8 11.1 12.3 13.1 12.8 … 13.6 13.3 13.8<br />
International trade taxes 0.9 1.1 1.1 1.3 1.3 … 1.4 1.4 1.6<br />
Income taxes 4.0 3.9 4.4 4.6 4.6 … 4.6 4.7 4.8<br />
Excises 2.3 2.5 2.7 3.0 2.7 … 3.2 3.0 3.2<br />
Value-added tax 3.6 3.6 4.0 4.2 4.1 … 4.2 4.2 4.3<br />
Infrastructure levy … … 0.1 0.1 0.1 … 0.1 0.1 0.1<br />
Nontax 0.5 0.5 0.6 0.7 0.6 … 0.7 0.6 0.7<br />
Oil revenue 0.0 0.0 0.2 0.1 0.1 0.1 0.1 0.1 0.0<br />
Grants 1.4 1.0 1.2 1.7 1.4 1.9 1.8 1.8 1.4<br />
Budget support 3 0.3 0.3 0.3 0.4 0.4 … 0.3 0.3 0.3<br />
Project grants 1.1 0.7 0.9 1.3 1.0 … 1.5 1.5 1.1<br />
Expenditures and net lending 4 16.2 16.6 18.5 22.1 19.7 22.2 22.5 21.9 20.8<br />
Current expenditures 9.0 9.5 9.9 10.7 10.8 10.3 10.4 10.4 10.3<br />
Wages and salaries 3.3 3.4 3.5 3.5 3.5 … 3.6 3.6 3.4<br />
Interest payments 1.4 1.4 1.6 2.0 2.0 … 2.2 2.3 2.6<br />
Other current 4.3 4.8 4.8 5.1 5.3 … 4.7 4.4 4.2<br />
Development expenditures 6.5 7.0 6.7 8.3 7.0 9.9 9.8 9.7 9.0<br />
Externally-financed projects 3.3 2.7 2.5 4.1 2.8 … 5.1 5.1 4.4<br />
Government of Uganda investment 3.2 4.4 4.2 4.2 4.1 … 4.7 4.5 4.6<br />
Net lending and investment 0.6 0.0 1.6 3.0 1.8 1.7 1.9 1.6 1.4<br />
Hydro-power projects 0.0 0.0 1.3 2.7 1.6 … 1.5 1.3 1.3<br />
Recapitalization 0.6 0.0 0.3 0.2 0.0 … 0.4 0.3 0.1<br />
Other spending 0.1 0.0 0.3 0.1 0.1 0.4 0.4 0.2 0.2<br />
Clearance of domestic arrears 0.1 0.0 0.3 0.1 0.1 … 0.1 0.2 0.2<br />
Contingency 0.0 0.0 0.0 0.0 0.0 … 0.3 0.0 0.0<br />
Float -0.3 -0.5 0.1 0.0 0.4 0.0 0.0 0.0 0.0<br />
Overall balance -3.2 -3.5 -4.4 -6.4 -5.2 -6.5 -6.2 -6.0 -4.9<br />
Underlying balance (excl. one-off spending) 5 -2.6 -3.5 -2.9 -2.3 -3.3 -4.9 -3.5 -3.5 -1.6<br />
Financing 3.2 3.5 4.4 6.4 5.2 6.5 6.2 6.0 4.9<br />
External financing (net) 2.2 1.3 1.2 4.8 2.9 5.9 5.4 5.3 3.9<br />
Disbursement 2.5 1.6 1.5 5.2 3.3 … 5.8 5.7 4.6<br />
Budget support 0.5 0.0 0.0 0.0 0.0 … 0.3 0.0 0.0<br />
Concessional project loans 2.0 1.6 1.5 1.6 1.8 … 2.6 2.7 1.5<br />
Non-concessional borrowing 0.0 0.0 0.0 3.6 1.5 … 2.5 2.2 3.1<br />
Revolving Credit 0.4 0.8 0.0<br />
Amortization (–) -0.3 -0.3 -0.3 -0.4 -0.4 … -0.4 -0.4 -0.8<br />
Exceptional financing 0.0 0.0 0.0 0.0 0.0 … 0.0 0.0 0.0<br />
Domestic financing (net) 1.0 2.2 3.2 1.6 2.2 0.6 0.9 0.7 1.0<br />
Bank financing 0.8 0.9 1.7 0.9 1.1 … 0.5 0.2 0.5<br />
Bank of Uganda 6 -0.1 -0.3 1.4 0.3 0.4 … 0.2 -0.3 0.1<br />
Commercial banks 0.9 1.2 0.3 0.6 0.7 0.3 0.3 0.5 0.4<br />
Nonbank financing 0.2 1.3 1.5 0.7 1.1 0.3 0.4 0.5 0.5<br />
Memorandum Items:<br />
Petroleum Fund (end-period stock) 7 2.5 2.3 0.2 0.3 0.3 … 0.4 0.4 0.4<br />
Energy fund (end-period stock) 1.2 1.1 0.2 0.0 0.0 … 0.0 0.0 0.0<br />
Sources: Ugandan authorities and IMF staff estimates and projections.<br />
1<br />
Fiscal year runs from July 1 to June 30.<br />
2 All figures are based on the 2009/10 rebased GDP released in November 2014.<br />
3<br />
Include mainly HIPC-related grants from FY 2013/14 onwards.<br />
4 Expenditure categories in FY2013/14 include clearance of arrears totaling 0.8 percent of GDP, mainly in Government of Uganda investment and other<br />
5<br />
The overall deficit excluding large infrastructure projects financed by nonconcessional external borrowing (e.g. HPPs), BOU recapitalization,<br />
6<br />
Net financing from the Bank of Uganda includes resources freed by MDRI relief.<br />
7<br />
The balances of the Oil Fund were transferred to the UCF and in line with the PFM Act, a new Petroleum Fund was opened with<br />
balances from recent oil revenue deposits.<br />
22 INTERNATIONAL MONETARY FUND
Table 2c: Uganda: Quarterly Fiscal Operations of the Central Government, 2015/16–2016/17 1,2<br />
(Billions of Ugandan Shillings)<br />
2015/16<br />
2016/17<br />
Q1 Q2 Q3 Q4 Annual Q1 Q2 Q3 Q4 Annual<br />
Est. Est. Est. Proj. Proj. Proj. Proj.<br />
Total revenue and grants 2,986 3,391 2,808 3,462 12,647 2,973 4,070 3,534 4,290 14,868<br />
Revenue 2,504 3,082 2,667 3,248 11,500 2,832 3,322 3,225 3,770 13,150<br />
Tax 2,365 2,946 2,540 2,982 10,833 2,695 3,172 3,069 3,488 12,424<br />
International trade taxes 254 289 250 284 1,076 282 324 311 350 1,267<br />
Income taxes 729 1,128 827 1,188 3,872 844 1,212 973 1,341 4,370<br />
Excises 502 598 584 616 2,300 627 653 738 750 2,767<br />
Value-added tax 865 913 865 878 3,522 926 966 1,029 1,029 3,950<br />
Infrastructure levy 15 17 14 16 63 17 17 17 17 69<br />
Nontax 139 136 126 144 545 137 150 157 154 597<br />
Oil revenue 0 0 0 121 121 0 0 0 128 128<br />
Grants 483 309 142 214 1,147 142 748 309 520 1,718<br />
Budget support 3 159 61 50 70 340 58 63 98 63 282<br />
Project grants 323 248 92 144 808 83 685 211 457 1,436<br />
Expenditures and net lending 3,885 4,930 3,706 4,206 16,727 4,144 6,273 4,575 5,472 20,464<br />
Current expenditures 2,166 2,275 2,315 2,412 9,169 2,502 2,369 2,285 2,553 9,710<br />
Wages and salaries 698 760 758 751 2,966 837 843 840 840 3,359<br />
Interest payments 389 354 482 456 1,682 614 518 501 555 2,188<br />
Other current 1,079 1,161 1,076 1,204 4,520 1,051 1,008 944 1,159 4,163<br />
Development expenditures 1,089 1,815 1,237 1,766 5,907 1,558 3,112 1,791 2,593 9,054<br />
Externally-financed projects 443 829 436 474 2,384 389 1,990 687 868 4,804<br />
Of which: Non-concessional borrowing 0 202 0 0 202 8 338 221 303 870<br />
Government of Uganda investment 646 784 801 1,292 3,523 1,162 784 883 1,421 4,250<br />
Net lending and investment 3 610 816 106 0 1,532 16 782 490 251 1,539<br />
Other spending 20 24 47 28 119 67 10 9 75 161<br />
Float -79 127 -185 450 313 264 0 0 -264 0<br />
Overall balance 4 -820 -1,667 -712 -1,194 -4,393 -1,434 -2,203 -1,041 -918 -5,596<br />
Underlying balance (excl. one-off spending) 5 -289 -521 -791 -865 -2,466 -1,147 -1,084 -329 -755 -3,315<br />
INTERNATIONAL MONETARY FUND 23<br />
Financing 820 1,667 712 1,194 4,393 1,434 2,203 1,041 918 5,596<br />
External financing (net) 703 1,173 252 365 2,494 192 2,732 1,092 903 4,920<br />
Disbursement 803 1,242 329 440 2,814 306 2,824 1,188 980 5,297<br />
Concessional project loans 446 428 223 440 1,537 298 1,305 476 418 2,497<br />
Non-concessional borrowing 357 813 106 0 1,276 8 812 712 561 2,093<br />
Revolving Credit 0 707 0 0 707<br />
Amortization (–) -100 -68 -77 -74 -320 -104 -94 -96 -79 -373<br />
Exceptional financing 0 0 0 0 0 -9 2 0 2 -4<br />
Domestic financing (net) 117 493 460 828 1,899 1,242 -529 -51 15 676<br />
Bank financing 34 30 430 428 923 724 -554 -131 181 220<br />
Bank of Uganda 3 302 41 -101 67 309 193 -579 -210 360 -236<br />
Commercial banks -268 -11 531 362 614 531 25 79 -179 456<br />
Nonbank financing 83 463 30 400 976 518 25 80 -166 456<br />
Sources: Ugandan authorities and IMF staff estimates and projections.<br />
1 Fiscal year runs from July 1 to June 30.<br />
2<br />
All figures are based on the 2009/10 rebased GDP provided by the authorities in October 2016.<br />
3 Include mainly HIPC-related grants from FY 2014/15 onwards.<br />
4<br />
The projections for the overall balance in FY17 are consistent with the adjusted ceiling on the overall balance, as defined in the TMU of the Staff Report for the Sixth<br />
Review of the PSI.<br />
5 The overall deficit excluding large infrastructure projects financed by nonconcessional external borrowing (e.g. HPPs), BOU recapitalization, and oil revenue.<br />
<strong>UGANDA</strong><br />
UGAN
<strong>UGANDA</strong><br />
Table 3. Uganda: Monetary Accounts, FY2012/13–FY2017/18 1,2<br />
(Billions of Ugandan Shillings unless otherwise indicated)<br />
2012/13 2013/14 2014/15<br />
2015/16<br />
2016/17 2017/18<br />
6th Rev Est. 6th Rev Proj. Proj.<br />
Depository Corporations Survey 3<br />
Net foreign assets 8,427 8,844 9,656 10,740 10,329 11,559 11,049 12,267<br />
Bank of Uganda 8,305 9,455 10,092 10,309 10,642 11,137 11,411 12,629<br />
Commercial banks 122 -611 -436 432 -313 422 -362 -362<br />
Net domestic assets 3,621 5,291 6,733 8,196 7,228 9,817 7,527 9,547<br />
Claims on public sector (net) 4 -17 623 1,911 2,658 2,841 3,161 3,061 3,574<br />
Claims on central government (net) -105 539 1,827 2,576 2,750 3,079 2,970 3,483<br />
Claims on the private sector 8,011 9,124 10,986 12,762 11,422 14,831 12,372 14,230<br />
Other items (net) 5,6 -4,373 -4,456 -6,163 -7,224 -7,035 -8,176 -7,907 -8,257<br />
Money and quasi-money (M3) 12,047 14,142 16,389 18,937 17,557 21,376 18,575 21,814<br />
Broad money (M2) 8,932 10,195 11,095 13,060 12,085 14,849 12,786 15,015<br />
Foreign exchange deposits 3,115 3,947 5,294 5,877 5,472 6,527 5,789 6,798<br />
Bank of Uganda<br />
Net foreign assets 8,305 9,455 10,092 10,309 10,642 11,137 11,411 12,629<br />
Net domestic assets -4,760 -5,363 -5,039 -4,416 -4,991 -4,567 -5,699 -6,502<br />
Claims on public sector (net) 4 -2,858 -3,059 -1,995 -1,731 -1,686 -1,508 -1,922 -1,822<br />
Claims on central government (net) -2,858 -3,059 -1,995 -1,731 -1,686 -1,508 -1,922 -1,822<br />
Claims on commercial banks -518 -889 -161 628 -461 1,206 -423 -400<br />
Other items (net) 5,6 -1,383 -1,415 -2,883 -3,312 -2,844 -4,264 -3,354 -4,280<br />
Base money 3,545 4,092 5,053 5,893 5,651 6,570 5,711 6,127<br />
Currency in circulation 2,453 2,746 3,232 3,650 3,392 4,150 3,573 4,196<br />
Commercial bank deposits 7 1,092 1,346 1,822 2,243 2,259 2,421 2,138 1,931<br />
Other Depository Corporations<br />
Net foreign assets 122 -611 -436 432 -313 422 -362 -362<br />
Net domestic assets 9,805 12,439 14,113 15,375 14,985 17,395 15,872 18,577<br />
Of which Claims on central government (net) 2,753 3,598 3,830 4,307 4,436 4,587 4,892 5,305<br />
Of which Claims on private sector 7,964 9,069 10,922 12,693 11,386 14,762 12,331 14,189<br />
Deposit liabilities to the non-bank public 9,927 11,828 13,677 15,806 14,621 17,816 15,510 18,215<br />
Shilling deposits 6,812 7,881 8,383 9,929 9,150 11,289 9,721 11,416<br />
Foreign exchange accounts 3,115 3,947 5,294 5,877 5,472 6,527 5,789 6,798<br />
Memorandum items:<br />
(Annual percentage change)<br />
Base money 17.7 15.4 23.5 16.6 11.8 11.5 1.1 7.3<br />
M3 6.6 17.4 15.9 15.5 7.1 12.9 5.8 17.4<br />
Credit to the private sector 6.4 13.9 20.4 16.2 4.0 16.2 8.3 15.0<br />
Base money-to-GDP ratio (percent) 5.5 5.8 6.5 7.0 6.7 7.1 6.1 5.9<br />
M3-to-GDP ratio (percent) 18.6 20.1 21.1 22.5 20.7 23.0 19.8 21.1<br />
Base money multiplier (M2/base money) 2.5 2.5 2.2 2.2 2.1 2.3 2.2 2.5<br />
Credit to the private sector (percent of GDP) 12.4 12.9 14.1 15.1 13.5 16.0 13.2 13.8<br />
Gross reserves of BoU (US$ millions) 2,912 3,394 2,895 2,745 2,962 2,910 2,980 3,101<br />
Velocity (M3) 5.4 5.0 4.7 4.5 4.8 4.3 5.0 4.7<br />
Exchange rate (Ush/US$, eop) 2,593 2,600 3,302 … 3,778 … … …<br />
Sources: Ugandan authorities and IMF staff estimates and projections.<br />
1<br />
Fiscal year runs from July 1 to June 30.<br />
2 All figures are based on the 2009/10 rebased GDP provided by the authorities in October 2016.<br />
3<br />
Starting on June 2013, the Bank of Uganda expanded the reporting coverage from Monetary Survey to Depository Corporations Survey.<br />
4 The public sector includes the central government, public enterprises, other financial corporations and local governments.<br />
5<br />
Including valuation effects, the Bank of Uganda's claims on the private sector and Claims on Other Financial Corporations.<br />
6<br />
Reflects actual and projected issuances for the recapitalization of Bank of Uganda.<br />
7 Inclusive of foreign currency clearing balances.<br />
24 INTERNATIONAL MONETARY FUND
<strong>UGANDA</strong><br />
Table 4. Uganda: Balance of Payments, FY2012/13–2017/18 1,2<br />
(Millions of US dollars unless otherwise indicated)<br />
2012/13 2013/14 2014/15 2015/16 2016/17 2017/18<br />
6th Rev Est. 6th Rev Proj. Proj.<br />
Current account -1,582 -2,105 -1,971 -2,357 -1,452 -2,850 -1,884 -2,316<br />
Trade balance -2,123 -2,367 -2,250 -2,169 -1,870 -2,505 -2,183 -2,416<br />
Exports, f.o.b. 2,912 2,706 2,738 2,687 2,705 2,691 2,865 3,149<br />
Of which: coffee 423 404 400 342 352 308 388 457<br />
Imports, f.o.b. -5,035 -5,074 -4,988 -4,856 -4,575 -5,196 -5,048 -5,565<br />
Of which: oil -1,028 -1,090 -933 -671 -647 -641 -743 -811<br />
Of which: government -438 -361 -224 -644 -494 -489 -585 -597<br />
Services (net) -405 -331 -685 -632 -696 -718 -591 -557<br />
Income (net) -528 -612 -444 -759 -430 -884 -462 -623<br />
Of which: interest on public debt -39 -45 -42 -71 -62 -123 -110 -188<br />
Transfers 1,473 1,204 1,407 1,202 1,543 1,257 1,351 1,280<br />
Private transfers 1,130 999 1,173 1,001 1,305 1,028 987 1,027<br />
Of which: workers' remittances (inflows) 817 696 792 769 820 790 721 779<br />
Official transfers 343 205 234 201 238 230 365 252<br />
Of which: budget support (including HIPC) 71 83 99 96 99 84 80 78<br />
capital gains tax 7 7 44 6 36 8 35 0<br />
Capital and financial account 1,519 1,793 1,170 2,218 1,025 3,018 1,906 2,438<br />
Capital account 33 91 99 226 120 264 129 137<br />
Of which: project grants 33 91 99 226 120 264 129 137<br />
Financial account 1,486 1,702 1,071 1,992 905 2,754 1,777 2,301<br />
Foreign direct investment 940 1,096 870 1,055 512 1,132 567 1,268<br />
Portfolio investment -47 5 -162 -10 -175 97 23 99<br />
Other investment 592 609 366 948 568 1,526 1,188 934<br />
Of which:<br />
Public sector (net) 534 313 422 1,196 708 1,556 1,387 1,083<br />
SDR allocation 0 0 0 0 0 0 0 0<br />
Build-up (-)/drawdown (+) of petroleum fund -7 -7 127 0 -6 127 -7 -7<br />
Loan disbursements 617 403 385 1,294 807 1,540 1,499 1,303<br />
Project support (loans) 497 322 385 379 436 687 707 417<br />
Budget support (loans) 120 0 0 0 0 75 0 0<br />
Non-concessional borrowing 0 81 0 915 371 778 792 885<br />
Amortization due -76 -83 -90 -98 -93 -112 -106 -212<br />
Commercial banks (net) 380 282 -103 -255 -40 5 10 -6<br />
Other private (net) -322 14 46 13 -99 100 -209 -143<br />
Errors and omissions 402 691 449 0 522 0 0 0<br />
Overall balance 338 378 -353 -139 95 169 22 123<br />
Financing -338 -378 353 139 -95 -169 -22 -123<br />
Of which:<br />
Central bank net reserves (increase = –) -334 -374 353 150 -93 -165 -18 -121<br />
Of which : SDR allocation 0 0 0 0 0 0 0 0<br />
Use of Fund credit -2 -2 -2 0 -1 0 0 0<br />
Memorandum items:<br />
Gross offical reserves 2,912 3,394 2,895 2,745 2,962 2,910 2,980 3,101<br />
Months of imports of goods and services 4.5 5.1 4.9 3.9 4.6 4.0 4.2 4.0<br />
Donor support 867 486 543 628 634 1,009 974 398<br />
Of which:<br />
Budget support (loans and grants) 191 83 99 96 99 159 80 78<br />
Project support (loans and grants) 530 413 484 605 556 951 836 554<br />
Current account balance (percent of GDP) -6.3 -7.6 -7.2 -9.7 -5.9 -10.7 -7.1 -8.2<br />
Current account balance (excluding grants) -6.6 -7.9 -7.5 -10.1 -6.3 -11.0 -7.4 -8.5<br />
Trade balance (percent of GDP) -8.5 -8.5 -8.2 -8.9 -7.6 -9.4 -8.2 -8.6<br />
Exports of goods (percent of GDP) 11.7 9.7 9.9 11.1 11.0 10.1 10.8 11.2<br />
Imports of goods (percent of GDP) 20.1 18.3 18.1 20.0 18.5 19.4 19.0 19.7<br />
Sources: Ugandan authorities and IMF staff estimates and projections.<br />
1 Fiscal year runs from July 1 to June 30.<br />
2 All figures are based on the 2009/10 rebased GDP provided by the authorities in October 2016.<br />
INTERNATIONAL MONETARY FUND 25
26 INTERNATIONAL MONETARY FUND<br />
Table 5. Uganda: Banking Sector Indicators, March 2013–June 2016<br />
(In percent)<br />
2013 2014<br />
2015<br />
Mar-13 Jun-13 Sep-13 Dec-13 Mar-14 Jun-14 Sep-14 Dec-14 Mar-15 Jun-15 Sep-15 Dec-15 Mar-16 Jun-16<br />
Capital adequacy<br />
Regulatory capital to risk-weighted assets 24.5 24.3 23.1 22.1 23.6 22.8 22.5 22.2 23.2 21.2 19.7 21.0 21.8 21.7<br />
Regulatory tier 1 capital to risk-weighted assets 1 21.4 21.2 20.3 19.1 20.9 20.3 19.9 19.7 20.8 18.8 17.3 18.6 19.1 19.0<br />
Asset quality<br />
NPLs to total gross loans 4.7 4.0 4.4 6.0 6.2 5.8 5.3 4.1 4.2 4.0 3.9 5.3 6.9 8.3<br />
NPLs to total deposits 3.5 2.9 3.2 4.3 4.2 4.1 3.7 2.9 3.1 2.9 2.9 3.9 4.9 5.8<br />
Specific provisions to NPLs 55.1 53.1 47.3 64.8 53.9 62.1 55.4 48.9 53.7 51.9 45.4 41.6 47.2 54.3<br />
Earning assets to total assets 69.6 70.0 70.7 69.6 69.3 68.9 71.5 71.5 70.4 69.5 69.6 69.2 70.1 68.0<br />
Large exposures to gross loans 34.8 36.0 35.4 37.9 33.6 32.3 37.2 38.3 35.2 40.0 43.5 40.9 42.2 41.5<br />
Large exposures to total capital 95.4 103.4 102.2 113.6 97.7 96.4 109.7 113.2 104.5 126.4 140.8 123.5 123.9 121.5<br />
Earnings and profitability<br />
Return on assets 3.6 3.3 3.2 2.0 2.4 2.1 2.2 2.6 2.5 2.8 2.7 2.6 2.8 2.2<br />
Return on equity 21.0 20.4 18.9 12.4 14.2 12.8 13.1 16.0 15.6 17.7 17.2 16.0 16.8 13.8<br />
Net interest margin 12.5 12.2 11.8 11.6 11.4 11.5 11.3 11.0 11.0 10.9 11.0 11.3 11.6 11.9<br />
Cost of deposits 4.3 4.1 3.9 3.7 3.6 3.7 3.7 3.5 3.4 3.3 3.3 3.3 3.4 3.4<br />
Cost to income 72.0 72.4 73.2 80.1 76.6 75.8 74.8 68.7 68.7 68.6 68.5 69.2 68.4 67.9<br />
Overhead to income 41.9 43.2 45.3 46.7 45.4 41.9 41.1 40.0 40.1 42.9 42.7 41.9 41.1 37.4<br />
Liquidity<br />
Liquid assets to total deposits 42.7 41.1 40.6 42.5 45.4 46.5 41.8 44.0 44.2 46.4 46.0 46.4 42.5 43.4<br />
Market sensitivity<br />
Foreign currency exposure to regulatory tier 1 capital -5.1 -6.7 -8.2 -3.2 -2.6 -6.7 -1.4 -6.9 -5.4 -5.7 -3.4 -5.9 -7.6 -6.2<br />
Foreign currency loans to foreign currency deposits 72.3 72.8 63.0 57.6 73.7 65.0 64.3 64.5 58.8 61.3 60.8 59.2 60.5 60.4<br />
Foreign currency assets to foreign currency liabilities 104.8 104.9 100.6 97.3 100.8 95.4 95.2 97.1 102.9 101.4 102.0 101.8 97.4 96.7<br />
2016<br />
<strong>UGANDA</strong><br />
Source: Bank of Uganda.<br />
1<br />
Under new rules, effective in December 2016, designed to ensure compliance with Basel III financial standards, tier one capital requirements were raised to 10. 5 percent from 8 percent, while the total regulatory<br />
capital ratio was raised to 14.5 percent from 12 percent. However, Systemically Important Banks (SIBs) will be required to maintain tier one capital of 11.5 per cent and a total regulatory capital ratio of 15.5 percent<br />
respectively. The cash reserve requirement for banks is 5.25 percent, and the liquidity coverage ratio is at 20 percent.
<strong>UGANDA</strong><br />
Appendix I. Letter of Intent<br />
Kampala, Uganda<br />
November 22, 2016<br />
Ms. Christine Lagarde<br />
Managing Director<br />
International Monetary Fund<br />
700 19 th Street, N.W.<br />
Washington, DC 20431,<br />
USA<br />
Dear Madame Lagarde:<br />
On behalf of the Government of Uganda, we would like to provide you with an update on the<br />
progress we have achieved under our economic program supported by the IMF’s Policy Support<br />
Instrument (PSI). Economic growth declined slightly in the context of a difficult global and<br />
regional situation, and uncertainties around the February 2016 general elections. Our decisive<br />
monetary policy actions under the inflation targeting regime successfully kept inflation under<br />
control. International reserves remain at adequate levels. However, the softer-than-anticipated<br />
growth together with election-related pressures affected our fiscal accounts.<br />
We observed all June 2016 quantitative assessment criteria, except one. Bank of Uganda<br />
successfully kept inflation within the bands of the inflation consultation clause, and increased its<br />
international reserve buffers. At the same time, the fiscal deficit was affected by revenue<br />
shortfalls—reflecting softer growth—and slightly more expansionary expenditure linked to<br />
elections. The indicative target on poverty reducing expenditure was respected. However, with the<br />
slightly higher fiscal deficit and concerns over government leaning too much on domestic<br />
financing from the banking sector, we were not able to repay the advance from Bank of Uganda<br />
by the end of the fiscal year. Instead, the outstanding advances will be repaid this fiscal year.<br />
Looking ahead, we remain committed to our objectives described in the context of the 6 th PSI<br />
review. In particular, we are implementing measures to increase the tax-to-GDP ratio by<br />
½ percent, and will ensure that the quality and composition of expenditure is protected in the<br />
context of a tight envelope. Bank of Uganda continues to target core inflation of 5 percent. Given<br />
a slightly tighter balance of payments, the scope for accumulating international reserves has<br />
narrowed, but the reserve coverage remains at adequate levels.<br />
We made good progress on structural reforms. Government adopted the PFM Act regulations and<br />
is preparing implementation instructions, thereby enhancing the efficiency of the budget process.<br />
We have also submitted the charter of fiscal responsibility to Parliament. The charter will set clear<br />
fiscal objectives and enhance fiscal transparency. The exercise to reconcile domestic arrears data<br />
has been practically completed, and we are resuming semi-annual arrears reporting and<br />
INTERNATIONAL MONETARY FUND 27
<strong>UGANDA</strong><br />
monitoring. The amendments to the Bank of Uganda Act are under preparation and will<br />
strengthen central bank independence.<br />
Furthermore, we are working closely with the Financial Action Task Force to ensure Uganda’s<br />
prompt exit from their “gray” list of jurisdictions with strategic deficiencies in Anti-Money<br />
Laundering/Counter Financing of Terrorism (AML/CFT). We expect to approve the remaining<br />
pieces of amendments to legislation by end-December 2016, thus allowing an on-site visit early<br />
in 2017 which should culminate with Uganda’s leaving the list in June 2017.<br />
As you know, Uganda’s financial sector is in good health and well capitalized. Most banks are<br />
already meeting Basel III capital requirements which will come into effect in December 2016.<br />
At the same time, Bank of Uganda recently had to take control of the third largest domestic<br />
systemically important bank which had become undercapitalized due to high non-performing<br />
loans. We continue to monitor the stability of the system closely, and are confident that our<br />
actions will protect deposits and safeguard financial sector stability.<br />
These and other details of our economic program are set out in the attached Memorandum of<br />
Economic and Financial Policies (MEFP) and the Technical Memorandum of Understanding (TMU).<br />
In light of the satisfactory performance and our continued commitment to and ownership of the<br />
program, we request completion of the seventh review under our Policy Support Instrument (PSI).<br />
We intend to work with the IMF and other development partners on the implementation of our<br />
program, and will consult with the Fund on the adoption of any further measures, and in advance<br />
of revisions to the policies contained in the MEFP, in accordance with the Fund’s policies on such<br />
consultation. We will provide the IMF with such information as the Fund requests in connection<br />
with our progress implementing the policies and reaching the objectives of the program. In the<br />
context of the eight review of the PSI, we plan to request a successor PSI program. We also<br />
consent to publication of the staff report, the letter of intent, the MEFP and the TMU for the<br />
seventh review under the PSI.<br />
Sincerely yours,<br />
/s/<br />
Hon. Matia Kasaija<br />
Minister of Finance, Planning, and<br />
Economic Development<br />
/s/<br />
Prof. E. Tumusiime Mutebile<br />
Governor Bank of Uganda<br />
Attachments:<br />
1. Memorandum of Economic and Financial Policies.<br />
2. Technical Memorandum of Understanding.<br />
28 INTERNATIONAL MONETARY FUND
<strong>UGANDA</strong><br />
Attachment I. Memorandum of Economic and Financial Policies<br />
INTRODUCTION<br />
1. This Memorandum of Economic and Financial Policies complements the agreed policies<br />
under the 2013, 2014, 2015 and May 2016 Memoranda of Economic and Financial Policies under<br />
Uganda’s Policy Support Instrument (PSI). It presents an update on the economic performance in<br />
FY2015/16 and preliminary outturns for the first quarter of FY2016/17. Looking ahead, the<br />
memorandum describes the macroeconomic policies and structural reforms the Government of<br />
Uganda will pursue over the remainder of FY2016/17. The memorandum proposes extension of<br />
quantitative targets, structural benchmarks, and other reform commitments through to end-<br />
June 2017.<br />
RECENT DEVELOPMENTS<br />
2. Following the February 18, 2016 Presidential and Parliamentary elections, President<br />
Museveni was sworn in, and the new Parliament and Cabinet took office in June.<br />
The government’s overarching objective is to achieve middle income status by 2020. To this end,<br />
over the medium term, we will continue to focus on the following priorities:<br />
i) Increasing production and productivity in the primary growth sectors of the<br />
economy, including agriculture, tourism, oil, gas and minerals;<br />
ii) Supporting private sector development for sustainable employment and economic<br />
growth;<br />
iii) Enhancing infrastructure development to provide affordable power and lower<br />
transportation costs for value addition and enhanced market access;<br />
iv)<br />
Enhancing economic management and domestic resource mobilization;<br />
v) Improving public service delivery; and<br />
vi)<br />
Improving efficiency in government operations.<br />
3. Growth was 4.8 percent in FY2015/16, slightly below the 5 percent achieved in the<br />
previous fiscal year. The growth recorded was held back by the difficult global environment<br />
(including the slowdown in China and Brexit) and complex geo-political conditions (impact of the<br />
situation in South Sudan); lower commodity prices; a deceleration in the execution of public<br />
infrastructure investments; a decline in private sector credit; and election and post-election<br />
related uncertainty. The key sectors that contributed to growth include services (especially the<br />
information and communication services), agriculture, and construction, while manufacturing<br />
experienced a notable slowdown.<br />
4. Construction of the key infrastructure projects, including the Karuma and Isimba hydropower<br />
projects and the Kampala-Entebbe Express Highway, is already underway. However, there<br />
were some supervision challenges with the Karuma construction during the year which resulted in<br />
INTERNATIONAL MONETARY FUND 29
<strong>UGANDA</strong><br />
cessation of operations for several months. To prevent this kind of problem, we have established a<br />
committee to supervise the works in reference to the implementation schedule and report<br />
progress to Cabinet on a quarterly basis. In terms of financing, by the end of June 2016, the<br />
China-Exim bank loans had been disbursed to 16.3 percent (or US$313 million) of the projects<br />
cost.<br />
5. Recent events in South Sudan continue to affect Uganda in a number of ways as Uganda<br />
continues to host a significant number of refugees with support from the international<br />
community, helping manage the humanitarian crisis. The slowdown in Ugandan exports to South<br />
Sudan and the decline in worker’s remittances may continue to adversely affect Uganda’s<br />
economic performance. In addition, many Ugandan traders are burdened with unpaid bills from<br />
the South Sudanese government, which threatens their commercial viability.<br />
6. Private sector credit growth decelerated to 3.1 percent year-on-year in September 2016,<br />
driven largely by provisioning for bad loans--which has heightened risk aversion of banks—as well<br />
as subdued economic activity. All sectors experienced a squeeze in loan disbursements with the<br />
exception of lending to electricity and water and personal and household loans. Lending to the<br />
manufacturing, trade, building and construction and the business services sectors was minimal,<br />
resulting in net recoveries in the most recent period to September 2016. Foreign currency lending<br />
which previously supported private sector credit has deteriorated significantly to a year on year<br />
growth rate of minus 1.9 percent in September 2016 relative to a 3.1 percent growth in June 2015<br />
(both adjusted for valuation changes). Local currency lending has on the other hand started<br />
recovering after having bottomed out in March 2016.<br />
7. Overall, the banking sector remains healthy, though Non-Performing Loans (NPLs) have<br />
increased and Bank of Uganda (BoU) had to intervene in one bank. The sector remains<br />
well-capitalized, liquid and profitable. However, NPLs as a ratio of gross loans increased from<br />
4.0 per cent in June 2015 to a peak of 8.3 percent at end-June 2016, declining afterwards to<br />
7.7 percent at end-September 2016. The main reasons for this increase according to a survey<br />
conducted in the industry are government domestic arrears, diversion of borrowed funds, the<br />
effect of political instability in South Sudan, insufficient cash flows resulting from the slowdown in<br />
economic activity, fraudulent practices, increased cost of borrowing following monetary policy<br />
tightening, and foreign exchange volatility that negatively affected repayment capacity of<br />
borrowers with loans denominated in foreign currencies. Stress tests show that the system<br />
remains resilient to shocks, including the impact of an increase in the industry average NPL ratio<br />
to 12.6 percent on bank capital, default of the single largest borrower in each bank, a sudden<br />
withdrawal of short-term deposits, a sudden withdrawal of the single largest depositor and the<br />
3 largest depositors in each bank.<br />
8. To ensure the stability of the financial system, BoU took over management of Crane Bank<br />
on October 20 th 2016. Crane Bank, the fourth largest overall—and the third largest domestic<br />
systemically important bank (D-SIB) —was undercapitalized following a significant increase in<br />
NPLs. BoU appointed a statutory manager and suspended the Board of Directors. The next key<br />
steps include ensuring that the bank’s capital base is restored and on this front, the new<br />
30 INTERNATIONAL MONETARY FUND
<strong>UGANDA</strong><br />
management is seeking a strategic investor. This intervention was successful in stopping deposit<br />
outflows. However, with an estimated share of credit to the private sector of 10 percent, Crane<br />
Bank’s predicaments will likely constrain further private sector lending in FY2016/17.<br />
9. The current account deficit including grants improved to 5.9 percent of GDP in<br />
FY2015/16, owing mostly to a decline in the private sector import bill, which is largely attributed<br />
to low international crude oil prices and a slowdown in economic activities during the year.<br />
The current account deficit was financed by project aid and FDI inflows. The overall balance of<br />
payments recorded a surplus of US$ 95 million leading to a net build up in reserves. In the first<br />
quarter of FY2016/17, BoU continued with the daily purchases of foreign exchange for reserve<br />
build up supported by the stability of the exchange rate. Following an annual average<br />
depreciation by nearly 25 percent in 2015, the exchange rate has remained relatively stable, with<br />
the shilling appreciating by 7.8 percent against the U.S. dollar on a year-on-year basis in<br />
September 2016. The relative stability of the exchange rate has been supported by subdued<br />
corporate sector activity and continued inflows from NGOs, the coffee export sector, and offshore<br />
portfolio investors. More recently, the market has experienced some sharp depreciation pressures<br />
following a rebound in corporate sector demand.<br />
10. We have made further progress toward the commencement of oil production in 2020.<br />
We recently issued eight production licenses in the oil sector, and companies should make their<br />
final investment decision within 18 months after receiving the licenses. We decided that the<br />
pipeline will go through Tanzania to the port of Tanga. Negotiations are progressing well<br />
regarding the necessary inter-governmental and host-government agreements. The pipeline<br />
project is estimated to cost US$ 3.5 billion and will be financed by the private sector.<br />
However, negotiations with the strategic investor for the planned oil refinery were unexpectedly<br />
called off, and we are exploring alternative options. We have established the national oil company,<br />
with a mandate to handle government’s commercial interests in the oil and gas sector, and the<br />
Petroleum Authority tasked with monitoring and regulating exploration, development and<br />
production of petroleum activities in Uganda.<br />
PERFORMANCE UNDER THE PSI THROUGH OCTOBER 2016<br />
11. In this complex environment, we maintained macroeconomic stability, guided by the<br />
objectives we had identified under our program. Specifically, we achieved all end-June monetary<br />
and external sector targets, while some fiscal targets proved challenging. We also made progress<br />
on the structural reform agenda, though some areas moved slower than had been hoped for.<br />
12. Importantly, core inflation is converging to our target and remained within the bands of<br />
the inflation consultation clause. In 2015, in response to emerging inflation pressures mostly<br />
linked to the exchange rate depreciation, we tightened monetary policy by 600 basis points from<br />
11 percent in March 2015 to 17 percent in October 2015. As a result, annual average headline<br />
inflation declined to 4.1 percent in October 2016 from a peak of 8.5 percent last December, and<br />
core inflation declined to 5.1 percent from 7.5 percent over the same period. The decline also<br />
reflects the strengthening of the shilling and lower food prices following increased agricultural<br />
INTERNATIONAL MONETARY FUND 31
<strong>UGANDA</strong><br />
production. With inflation forecast to stay close to our target, as well as subdued aggregate<br />
demand and a relatively stable exchange rate, BoU reduced its Central Bank Rate (CBR) in April,<br />
June, and August 2016. In the October meeting, BoU decided to further reduce the CBR by<br />
100 bps to 13 percent, with a benign inflation outlook that allows for support of the domestic<br />
growth momentum.<br />
13. Given strong foreign exchange inflows and BoU programmed dollar purchases, the<br />
Quantitative Assessment Criteria (QAC) for net international reserve accumulation was met with a<br />
comfortable margin. At the end of June 2016, net international reserves (NIR) stood at<br />
US$ 2,962 million, equivalent to 4.5 months of imports of goods and services. By September 2016,<br />
and following BoU purchases of US$ 249.1 million, the stock was equivalent to 4.4 months of<br />
import cover.<br />
14. Fiscal policy was faced with revenue shortfalls and higher-than-expected election-related<br />
expenditures. On the revenue side, the shilling depreciation dampened import demand, resulting<br />
in shortfalls of international trade taxes and excises relative to PSI targets of Ushs 44 billion and<br />
Ushs 190 billion respectively. The infrastructure levy also slightly underperformed. VAT collections<br />
remained on target, while income tax exceeded projections under the PSI by around Ushs<br />
30 billion. Overall, we missed our end-June indicative target (IT) by a margin of Ushs 207 billion or<br />
0.2 percent of GDP. On the expenditure side, the government had to shoulder unexpected<br />
additional spending on election-related needs that exceeded the revised allocations agreed<br />
during the 6 th PSI review. Furthermore, spending on externally financed investment projects<br />
proceeded slower than hoped for because of absorptive capacity constraints resulting from<br />
implementation challenges. However, we met the IT on poverty reducing expenditure which we<br />
protected for its importance.<br />
15. Against this backdrop, we were not able to achieve our fiscal deficit QAC, even though<br />
the overall deficit was 1.2 percent of GDP lower than we had anticipated at the time of the last PSI<br />
review. With the revenue shortfall and higher-than anticipated domestic spending, the end-<br />
June 2016 QAC on the overall deficit was missed by 0.5 percent of GDP. That notwithstanding,<br />
government debt at 34.5 percent of GDP at end-June 2016 is lower than expected under the<br />
program, reflecting the under-spending on externally financed projects. The deficit IT was also not<br />
respected in the first quarter of FY2016/17 given the frontloading of some key expenditures,<br />
including for repayment of arrears, and softer revenue collection.<br />
16. Given these developments, we had to rely more on domestic financing than anticipated.<br />
By June, we issued domestic securities of 1.6 percent of GDP on a net basis in the primary market,<br />
exceeding the forecast underlying our program. In addition, we took a temporary advance from<br />
BoU. Given the domestic financing needs and concerns over crowding out private sector credit,<br />
the government was unable to fully repay these advances by the end of the fiscal year, thus<br />
missing the related IT. The advances will be repaid during this financial year.<br />
17. We are fully aware and concerned about the impact government domestic arrears are<br />
having on the private sector. Arrears have been identified as one of the reasons for rising NPLs in<br />
32 INTERNATIONAL MONETARY FUND
<strong>UGANDA</strong><br />
the banking sector, putting companies in a difficult situation, and more generally weighing on<br />
business sentiment. We have undertaken an exercise to reconcile the stock of arrears from<br />
internal audit and final accounts, by reviewing submissions from all government entities to come<br />
up with a harmonized position. The data show that the stock of arrears was Ushs 1.4 trillion in<br />
June 2014 and Ushsin June 2015, and, preliminarily, Ushs 2.7 trillion in June 2016. The increase<br />
registered in 2016 is the result of some methodological issues—including the fact that some new<br />
reporting entities were unable to provide figures for years prior to June 2016, including<br />
universities and examination boards—and some other factors including (i) the formalization of a<br />
commitment to pay pensions and gratuity for veterans, that could only be measured this fiscal<br />
year, which accounts for nearly half of the increase in arrears; (ii) the increase in court awards and<br />
compensation; (iii) outstanding commitments of National Medical Stores; and (iv) VAT arrears<br />
amounting to Ushs 71 billion under the Ministry of Finance Planning, and Economic Development.<br />
18. We have made progress on our structural reform agenda, though some items are taking<br />
longer than we had hoped for. The Public Financial Management (PFM) Act regulations were<br />
gazetted in June 2016. Although not the full level of detail could be included, treasury instructions<br />
currently under preparation are expected to cover detailed aspects of financial management and<br />
accountability processes. The Charter of Fiscal Responsibility has been presented to Parliament for<br />
approval and contains clauses on the levels of the fiscal deficit and public debt consistent with<br />
maintaining macroeconomic stability. We have finalized the Appraisal User Manual, which is<br />
expected to be published and disseminated to all Ministries, Departments and Agencies by end-<br />
December 2016, to help guide project preparation and appraisal (structural benchmark). In<br />
addition, the Development Committee Guidelines have been updated, and will be published by<br />
end-December, in order to help ensure compliance with the Appraisal User Manual (structural<br />
benchmark). A cabinet memorandum on the principles for amending the BoU Act has been<br />
prepared and will be presented to cabinet and thereafter to Parliament by March 2017 (structural<br />
benchmark). The AML Amendment Bill 2016 which was submitted to the previous Parliament has<br />
been re-published and recommitted to the new Parliament in October 2016 for discussion and<br />
approval by end-December 2016. The Amended AML Act also contains provisions to address<br />
deficiencies highlighted in the 2016 Mutual Evaluation Report, namely: adequately expanding the<br />
scope of record-keeping requirements to apply to all financial institutions; and designating<br />
supervisory bodies with necessary powers to enforce financial institutions’ compliance with<br />
AML/CFT obligations, including proportionate and dissuasive sanctions. The Insurance Regulatory<br />
Authority (amendment) Bill was recently resubmitted to the First Parliamentary Council before<br />
being sent to the relevant Parliamentary Committee, and is also expected to be considered and<br />
approved by Parliament by end-December 2016. The Anti-Terrorism Act has been amended to<br />
properly criminalise the financing of terrorism and submitted to Parliament for its approval. We<br />
will engage closely with Parliament to ensure a speedy passage by end-December 2016 (structural<br />
benchmark).<br />
INTERNATIONAL MONETARY FUND 33
<strong>UGANDA</strong><br />
MACROECONOMIC OUTLOOK AND RISKS<br />
19. Real GDP growth is projected at about 5 percent, on account of the continuation of the<br />
infrastructure investments and a muted recovery in private sector demand. Inflation is projected<br />
to remain close to its medium term target on account of a relatively stable exchange rate and<br />
lower commodity prices especially oil. We anticipate that the current account deficit will widen<br />
resulting from subdued exports partly because of the strife in South Sudan –a key export market,<br />
as well as the low international prices of our export commodities. On the other hand, the level of<br />
imports remains high – in particular intermediate input and government infrastructure related<br />
imports. The level of international reserves will remain adequate at around 4 months of import<br />
cover. Private sector credit is expected to recover to about 8 percent, following monetary policy<br />
easing, while the exchange rate is projected to remain relatively stable.<br />
20. Over the medium-term, the expected start of oil production in FY2020/21, together with<br />
the growth dividend from completion of our infrastructure investment projects, are projected to<br />
improve Uganda’s growth prospects and fiscal and current account dynamics.<br />
21. The risks to the outlook arise from the current global and regional situation. On the<br />
global front, a slow recovery in global growth coupled with low commodity prices could impact<br />
export growth, while the continued unease in the financial markets could impact direct investment<br />
and financing flows. Implementation challenges for public investment projects remain a key<br />
factor that could hinder reaping of the growth dividend, while sustained foreign exchange<br />
demand for infrastructure projects, widening current account position, civil strife in South Sudan<br />
and volatile global financial markets remain key risks to the exchange rate.<br />
POLICIES FOR THE REMAINDER OF FY2016/17 AND BEYOND<br />
22. Macroeconomic policies remain aligned with our objective of ensuring macroeconomic<br />
stability and enhancing sustainable growth. Our medium term strategy continues to be based on<br />
scaling up infrastructure investment to remove key constraints to growth; protecting essential<br />
poverty-alleviating expenditure; increasing production and productivity; and enhancing domestic<br />
revenue mobilization. These policies will go hand in hand with structural reforms to further<br />
improve the business environment to support private sector growth. Fiscal sustainability and<br />
maintaining government debt at a low risk of distress constitute the anchor of our growth<br />
strategy.<br />
23. In the remainder of FY2016/17, government policies will continue to focus on supporting<br />
economic growth, while adhering to our fiscal framework and keeping inflation within the target<br />
band. Fiscal policy will continue the process of scaling up infrastructure investment and prioritize<br />
the quality of spending. In addition, the government targets a revenue increase by ½ percent of<br />
GDP. Settling government domestic arrears and containing the need for domestic financing<br />
34 INTERNATIONAL MONETARY FUND
<strong>UGANDA</strong><br />
should facilitate private sector activity. Monetary policy will remain focused on ensuring price and<br />
financial stability in an environment of a benign inflation outlook.<br />
Fiscal Policy<br />
Strengthening our efforts to enhance revenue mobilization<br />
24. In the first quarter of FY2016/17 revenue collection underperformed, due to weaker<br />
import demand. In the first two months of the quarter, revenue collections on corporation tax,<br />
withholding tax, VAT on services, and excise duties on sugar, soft-drinks and imports, were all<br />
below their respective targets. However, the trend got better with overall collections for<br />
September recording a surplus relative to projections.<br />
25. We are implementing tax policy measures to yield the agreed revenue increase of at least<br />
Ushs 500 billion at the time of the 6 th review. On the tax policy side, this includes the adjustments<br />
in excise duty on fuel, motor vehicle lubricants, cement, sugar, various other fees and levies.<br />
However, two of these measures (increases in excise duty on cement and the environmental levy<br />
on used clothing) were rejected by Parliament and could not be implemented. To compensate for<br />
that, we have strengthened revenue administration, including boosting the public sector office<br />
operations, strengthening valuation controls, debt collection and undertaking joint compliance<br />
activities with local government. Other measures include; further expansions to single customs<br />
territory activities and close monitoring of current declarations. We continue implementing<br />
reforms to ease the cost of doing business. Through the implementation of business licensing<br />
reforms, the time taken to register a business has been reduced from 33 days in 2013 to 24 hours.<br />
Uganda’s ranking in the World Bank Doing Business report has improved seven positions in 2016<br />
reflecting these improvements and enhancements in the tax system. With collaboration under Tax<br />
Registration Enhancement Programme, 4 institutions (namely Uganda Revenue Authority (URA),<br />
Uganda Registration Services Bureau (URSB), Kampala Capital City Authority (KCCA), and the<br />
National Social Security Fund (NSSF)) are working together to ensure that upon registration of<br />
business, an enterprise immediately gets a Tax Identification Number (TIN), trading license and<br />
NSSF registration.<br />
26. Government is committed to further reforms of the tax policy and tax administration<br />
consistent with the policy target on increasing revenue by 0.5 percent of GDP per year. We remain<br />
fully committed to reducing the scope of tax exemptions and tax holidays in order to support<br />
domestic revenue mobilization. However, we will be mindful of the need to balance revenue<br />
enhancement with private sector development and welfare. We welcome additional IMF technical<br />
assistance (TA) in this area, in particular to review capacity and structures of URA with regards to<br />
implementing the tax laws.<br />
27. We have just joined the Addis Tax initiative and thus further signaled our commitment to<br />
continue stepping up domestic revenue mobilization and pursue policy coherence for<br />
development.<br />
INTERNATIONAL MONETARY FUND 35
<strong>UGANDA</strong><br />
Expenditure - focusing on efficiency, quality, and reprioritization<br />
28. In the first half of the year, we decided to frontload a significant amount of expenditure.<br />
The front loading was necessitated by the need to clear domestic arrears, meet counter-part<br />
financing obligations under roads and energy and meet other requirements under social services.<br />
Overall budget implementation reached 52 percent, particularly in development and Poverty<br />
Action Fund (PAF) related expenditures.<br />
29. For the remaining second half of the fiscal year, we plan to target an annual budget<br />
execution rate of 96 percent, implementing cuts to some categories of recurrent expenditure.<br />
These savings will be made in the non-essential aspects of the nonwage recurrent expenditure of<br />
central government, such as travel inland, travel abroad, workshops and seminars, and advertising.<br />
The cuts are not deemed to generate arrears because they will fall on non-contractual obligations<br />
arising out of targeted areas. Poverty reducing expenditure and counterpart funding obligations<br />
under domestic development will be protected. Furthermore, we shall be able to accommodate<br />
additional demands of about Ushs 100 billion arising out of the unfolding food emergency<br />
situation in 80 districts in the country.<br />
30. Expenditure priorities have not changed. We will continue to focus on the scaling up of<br />
infrastructure and on improving human and social capital. On infrastructure, the key projects to be<br />
implemented this year include, among others: Karuma and Isimba dams, roads, and the<br />
rehabilitation of Entebbe airport. Since implementation of the projects has historically lagged<br />
behind and we are being affected by poor execution of projects, we have agreed to continue to<br />
strengthen public investment management through putting in place guidelines to sectors on<br />
appraisal, sequencing and implementation of projects.<br />
31. On the social and poverty-alleviating expenditure we plan to devote 21.5 percent of our<br />
budget to health and education, in particular areas targeting primary health care, funding for<br />
malaria and HIV/AIDs, and the school capitation grant in the education sector. Furthermore, a new<br />
Integrated Early Childhood Development policy has just been launched targeting children from<br />
conception to 8 years. The policy includes enhancing prenatal and postnatal care, early infant<br />
simulation and education, parent education, health and nutrition education and care, sanitation,<br />
and protection against abuse, exploitation and violence. Priority is on the most vulnerable children<br />
who are to benefit from quality services for holistic development.<br />
32. On social protection, the Poverty Assessment Report (2016) alludes to the fact that<br />
46 percent of Uganda’s population is insecure non-poor which implies that they are prone to<br />
falling back into poverty when hit by a shock. In order to mitigate such shocks, government is<br />
investing in social protection mechanisms which include (i) identification, verification, and<br />
payments of pensions, including pension arrears, (ii) the Social Assistance Grant for Empowerment<br />
(SAGE), which provides direct cash transfers to the elderly in the pilot districts and has been<br />
allocated additional resources for its operations; (iii) continued funding for the Youth Livelihood<br />
Programme through allocations of Ushs 85.2 billion; and (iv) the Uganda Women<br />
36 INTERNATIONAL MONETARY FUND
<strong>UGANDA</strong><br />
Entrepreneurship Programme (UWEP) (Ushs 43 billion), which has been rolled out in 19 districts<br />
and Kampala City as a pilot to benefit vulnerable women.<br />
33. Government is implementing a skills development program for employment and<br />
enhanced productivity and growth. The objective is to create employable skills and competencies<br />
relevant in the labor market and to enhance participation of the private sector in policy<br />
development planning, implementation, monitoring and evaluation including financing and<br />
training.<br />
34. We are committed to improving service delivery and value for money and recognize that<br />
improving implementation performance must be a key area. Service delivery will be enhanced by<br />
drawing on lessons from the first national social service delivery atlas, produced by the Ministry of<br />
Finance, UNICEF and EPRC, which identifies service points by local government and the impact of<br />
public investments on social outcomes. This will further focus the spot-light on the processes,<br />
contexts, and determinants of the delivery of public services and goods. In light of project<br />
implementation delays, contract management and social safeguards management concerns, the<br />
World Bank recently decided to freeze lending for new projects, while disbursements for ongoing<br />
projects continue. This freeze particularly affected the Development Policy Support Loan (budget<br />
support) that we had included in the budget in the current fiscal year. We are working closely with<br />
the World Bank to resolve the issues raised, and are taking a number of social safeguard<br />
measures, including; completing the outstanding Resettlement Action Plans (RAPs) for the<br />
affected projects, and adopting a policy on Gender-Based Violence (GBV) and Child Abuse. We<br />
are also developing an emergency protection response to provide holistic services to all<br />
vulnerable groups affect by GBV and abuse. Government has enhanced the process of portfolio<br />
review with respective development partners and is strengthening the capacity of implementing<br />
agencies in project supervision, contract management and monitoring.<br />
35. The refugee influx to Uganda has increased significantly, making Uganda one of the top<br />
refugee recipients in Africa and the world. With a refugee population of around 922,000 and<br />
about 2000 to 3000 arrivals a day, most of them children and women, pressures on service<br />
delivery by local governments are mounting (and ultimately possibly in budget). Uganda has a<br />
very progressive refugee management system that provides refuges with the same rights as<br />
nationals, including access to health, education, provision of land and right of establishment.<br />
We strongly believe this is the fairer and more equitable system that provides refuges with<br />
opportunities. However, to be able to continue implementing our model, there is an urgent need<br />
for the international community to step up its contributions, as the refugee response plan is only<br />
about 20 percent funded.<br />
Financing - Minimizing private sector crowding out and impact on inflation<br />
36. Since the advances received from BoU throughout the FY 2015/16 year were not fully<br />
repaid by end-June 2016, we plan to reimburse the central bank in a phased manner during<br />
quarter two and three. Looking ahead, temporary advances from the BoU will only be used for<br />
cash management purposes and not go beyond 10 percent of projected revenue, as stated in the<br />
INTERNATIONAL MONETARY FUND 37
<strong>UGANDA</strong><br />
PFM Act, and be repaid before the end of the current fiscal year. Furthermore, such advances will<br />
bear an interest cost aligned with market rates, as stated in the BoU Act 2000.<br />
37. We plan to finance the budget using domestic, concessional and non-concessional loans.<br />
Non concessional financing will include the PTA loan, which amounts to US$ 200 million and is<br />
planned to be disbursed this fiscal year. As with all other budget support, the PTA loan resources<br />
will be disbursed to an account held at the BoU. We will also have to increase domestic debt<br />
issuances by Ushs 300 billion, which we believe the market can absorb given current liquidity<br />
conditions.<br />
38. Government’s core principle continues to be ensuring that debt remains at low risk of<br />
distress through long-term prudent debt management, as outlined in the Medium Term Debt<br />
Management Framework, which aims at minimizing costs and risks associated with public<br />
investment project financing. The updated Debt Sustainability Analysis (DSA) results show that<br />
debt remains at low risk of distress. However, to sustain this position, the resource bases (GDP,<br />
revenue, export) need to be improved to minimize risks, in particular from weak exports. We are<br />
also cognizant of risks from contingent liabilities, including those from public-private partnerships.<br />
We will closely monitor developments, and stand ready to adjust policies as needed to safeguard<br />
debt sustainability. We will continue to engage with IDA/IMF staff on debt management issues<br />
and to address the short maturity of domestic debt by building policy credibility and deepening<br />
the markets.<br />
Monetary and Financial Sector Policies<br />
39. BoU will continue to be guided by its inflation forecast in determining whether the<br />
current easing cycle can continue. Risks to the inflation forecasts emanate from the future path of<br />
the exchange rate, food price dynamics, the extent of fiscal prudence, as well as uncertainty in the<br />
global financial markets resulting from the vote by the United Kingdom to leave the EU and the<br />
evolution of commodity prices, especially oil.<br />
40. BoU is committed to avoiding excessive volatility in the exchange rate without impeding<br />
the real exchange rate from reflecting market conditions. As such, interventions in the foreign<br />
exchange market will remain limited to preventing excessive volatility. Interventions will continue<br />
to be sterilized. BoU shall continue to look out for opportunities in the market to purchase foreign<br />
exchange from the market for reserve build up to ensure stability.<br />
41. BoU will be recapitalized by Ushs 100 billion in Q2 of FY2016/17 to facilitate monetary<br />
policy management. Following the amendments to the Bank of Uganda Act (expected shortly), a<br />
dynamic capital rule will be introduced which ensures that capital will be maintained as a share of<br />
monetary liabilities. In the meantime, there is excess structural liquidity build up in the system that<br />
requires sterilization by BoU. In this context, we are planning to reactivate deposit auctions as an<br />
instrument for liquidity management alongside repos.<br />
38 INTERNATIONAL MONETARY FUND
<strong>UGANDA</strong><br />
42. We are monitoring closely developments in the financial sector and will continue to do<br />
so to ensure the soundness of the system. The sector has been affected by a continued<br />
deterioration in asset quality, which is expected to remain a concern for the short term.<br />
Furthermore, the recent developments regarding Crane Bank’s take over by BoU have impacted<br />
market sentiment. Nonetheless, banks remain well capitalized and able to absorb losses.<br />
In December 2016, we will be implementing new capital requirement provisions aligned with Basel<br />
III: all banks will be required to have a Capital Conservation Buffer (CCB) of 2.5 percent of Risk-<br />
Weighted Assets (RWA) above the minimum capital requirements; all D-SIBs will be required to<br />
have additional capital of between 1–3.5 percent of RWA above the minimum capital<br />
requirements and CCB. The sector is on track to meet these requirements, as most banks –<br />
particularly the big ones, have already complied with the requirements. To reassure the markets<br />
and provide for quality assurance, we would like to request support to conduct an updated FSAP<br />
analysis. The FSAP would help us to draw lessons to strengthen our financial sector.<br />
43. BoU is undertaking reforms in the primary dealership system in the government<br />
securities market to alleviate the challenges affecting their ability to fulfil their obligations. A set of<br />
reforms to address distribution constraints and provide the opportunity for banks to demonstrate<br />
the ability to meet the obligations of a primary dealer, especially market making and secondary<br />
market trading have been approved. In the reforms, all banks will be required to post two-way<br />
quotes for on-the-run securities and these quotes will be good for Ushs 250 million; be able to<br />
open CSD accounts for their clients directly through an online platform called the Primary Dealer<br />
Shared Gateway (PDSG); submit bids for their clients and settle bids of their clients, in addition to<br />
settling their own proprietary bids. BoU also engaged a consultant to review the draft Master<br />
Repo Agreement. The consultant noted that there were too many gaps and shortcomings,<br />
including not providing adequate cover for banks if a counter-party faced insolvency. Uganda will<br />
adopt a globally recognized Global Master Repurchase Agreement (GMRA), but with a Uganda<br />
annex and a buy/sell back annex be appended to it.<br />
44. In addition, the Financial Institutions Act (FIA) was amended in 2016 to allow for agent<br />
banking, bancassurance and Islamic banking. The Tier IV Microfinance Institutions Act was passed<br />
by Parliament, which will provide oversight for Savings and Credit Cooperatives (SACCOs), Money<br />
Lenders and Micro Finance Institutions. Consumer protection has been enhanced by requiring<br />
Supervised Financial Institutions (SFIs) to provide a key facts document to consumers for the<br />
products they offer. In addition, a complaints desk has been set up at the BoU to address<br />
consumer complaints as well as a review of consumer complaints during on-site examination.<br />
45. The mobile money market continues to evolve, with over 21 million registered customers.<br />
In April 2016, one additional player joined the mobile money market. The new mobile money<br />
service is not tied to a particular mobile phone network or bank rather it is an internet-based<br />
application. Furthermore, at the start of FY 2016/17, a mobile money service provider launched a<br />
micro savings and loan product that allows registered users to borrow and save money using<br />
their mobile phones. The 2013 Mobile Money Guidelines, issued by BoU, have been a useful tool<br />
to provide clarity and stipulate the roles and responsibilities of the parties, while enhancing<br />
INTERNATIONAL MONETARY FUND 39
<strong>UGANDA</strong><br />
competition, financial inclusion and consumer protection. However, to ensure the smooth<br />
operation of the mobile money services and to protect the integrity and stability of the financial<br />
system, Ministry of Finance and BoU are working together to develop a more comprehensive<br />
legal, regulatory and supervisory framework for mobile money activities (structural benchmark).<br />
46. Government is committed to ensuring the prompt exit of Uganda from the Financial<br />
Action Task Force (FATF) Grey list. We have accomplished significant progress, including passing<br />
further amendments to the Anti-Terrorism (Amendment) Act by Parliament; and the gazetting of<br />
the Anti-Terrorist Regulations and of the AML Regulations. Looking forward, we will accelerate the<br />
adoption of the remaining measures to ensure prompt exit from the FATF Grey list, including the<br />
approval by Parliament of the amendments to the AML and Anti-Terrorism Acts (structural<br />
benchmark by December 2016). We will also aim to have the mutual evaluation report widely<br />
publicized; complete the national risk assessment and have its report adopted by cabinet and<br />
subsequently published on the Financial Intelligence Authorities’ website; prepare a five-year<br />
Strategic Plan and communications strategy for the Financial Intelligence Authority and initiate<br />
the update and preparation of the national AML/CFT policy.<br />
STRUCTURAL REFORMS<br />
47. To prevent reoccurrence of arrears, we plan to include the non-accumulation of arrears<br />
as a key criterion for reappointing accounting officers. In addition, accounting officers have been<br />
asked to migrate all electricity and telephone utilities from the post-paid to the prepaid systems<br />
by 30th June 2017.Thereafter, no funds will be released to non-compliant Ministries and Agencies,<br />
while accounting officers who create arrears will face disciplinary action, including termination of<br />
their appointments. We would like to request IMF TA to further strengthen our processes and<br />
prevent the reoccurrence of arrears. In terms of our reporting requirements, we will continue to<br />
publish semi-annual reports on unpaid bills (end-December) and arrears (end-June) for the<br />
agreed ministries and government departments (structural benchmarks), and we have provided<br />
reports signed by the PS/ST on the stock of outstanding arrears at end-June 2014, end-June 2015,<br />
and end-June 2016 (preliminary), reconciled between the Accountant General and the Internal<br />
Audit Department of the Ministry of Finance, Planning, and Economic Development.<br />
48. We will continue our efforts to further strengthen the implementation of infrastructure<br />
projects. We have finalized the Appraisal User Manual and Development Committee Guidelines to<br />
ensure that no project is included in the Public Investment Plan (PIP) unless a feasibility study has<br />
been done and counterpart funding is provided for in the medium term budget framework. The<br />
manual details a step-by-step guide to the MDAs in the preparation and appraisal of projects. We<br />
are setting up an Integrated Bank of projects that will act as a central depository for all public<br />
projects in Uganda and enable tracking of the development process of projects on a real time<br />
basis and will also establish a project Development Facilitation Fund to allow a number of priority<br />
projects to undergo feasibility and/or pre-appraisal studies while awaiting inclusion in the PIP and<br />
annual budget by March 2017. On the basis of diagnostic study on strengthening public<br />
investment management, we are finalizing a project preparation manual, which will set out<br />
national parameters, shadow prices and conversion factors to be used in all economic project<br />
40 INTERNATIONAL MONETARY FUND
<strong>UGANDA</strong><br />
appraisals prior to admission into the PIP. This will be used to guide decision making on new<br />
projects (structural benchmark, March 2017).<br />
49. We continue upgrading our PFM and cash management systems for instance the<br />
Treasury Single Account (TSA) framework was extended to 56 Local Governments (LGs), (14 LGs<br />
on IFMS Tier 1 in July 2015 and an additional 42 LGs on IFMS Tier 2 in January 2016).<br />
Further extension of more LGs on TSA will depend on their enrolment onto IFMS. We are also<br />
minimizing use of cash through Electronic Funds Transfer.<br />
50. We are also in the process of establishing a framework for following up and reporting on<br />
the implementation on the recommendations of value-for-money audits conducted by the<br />
Auditor General’s office (structural benchmark, March 2017). In addition, a Public Expenditure and<br />
Financial Accountability (PEFA) exercise has commenced and is jointly undertaken with the World<br />
Bank. A Fiscal Transparency Evaluation (FTE) was just completed for Uganda, showing that there<br />
are good and advanced practices being applied, but more work needs to be done in some areas,<br />
especially relating to coverage, quality and reliability of budget information. The government is<br />
undertaking a number of measures to improve budget credibility, including the alignment of work<br />
plans, procurement plans, recruitment and cash-flows to the budget using the Output Based Tool<br />
and the development of an integrated macro-economic model to improve fiscal forecasting.<br />
51. The strategic plan for the Public Procurement and Disposal of Public Assets Authority<br />
(PPDA) identifies strengthening accountability and transparency in public procurement as one of<br />
its top priorities. We plan to roll out e-procurement to 50 percent of all Procuring and Disposing<br />
Entities by FY 2018/19 to increase efficiency, transparency, and public confidence. Government<br />
has initiated a process of amending the PPDA Act, which will among others streamline the<br />
processes associated with administrative reviews of public procurements. This remains the source<br />
of the extensive delays which affect project start dates.<br />
PROGRAM MODALITIES<br />
52. Progress in the implementation of the policies under this program will be monitored<br />
through QAC, ITs, and structural benchmarks (SBs) detailed in the attached Tables 1 and 2 and<br />
through semi-annual reviews. The eighth review is expected to be completed by end-June 2017.<br />
The attached Technical Memorandum of Understanding—which is an integral part of this<br />
memorandum—contains the needed definitions.<br />
53. We will continue to consult with the IMF on major policy initiatives before decisions are<br />
made.<br />
INTERNATIONAL MONETARY FUND 41
42 INTERNATIONAL MONETARY FUND<br />
Table 1.1. Uganda: Quantitative Assessment Criteria and Indicative Targets for December 2015–March 2017 1<br />
(Cumulative change from the beginning of the fiscal year, unless otherwise stated)<br />
Program Adjusted<br />
Target<br />
Dec. 31, 2015 2 Mar. 31, 2016 2 Jun. 30, 2016 2<br />
Sep. 30, 2016 3<br />
Dec. 31, 2016 3 Mar. 31, 2017 3<br />
Outturn Result Program Adjusted<br />
Target<br />
Outturn Result Program Adjusted<br />
Target<br />
Prel. Result Program Adjusted<br />
Target<br />
Prel. Result Program<br />
(Billions of Ugandan shillings)<br />
Quantitative Assessment Criteria<br />
Ceiling on the overall deficit of the Central Government 2,346 2,113 2,325 Not met 3,814 2,828 3,066 Not Met 5,382 3,798 4,260 Not Met 1,590 523 1,447 Not Met 3,983 3,646 4,988 4,688<br />
(Millions of US dollars)<br />
Ceiling on the stock of external payment arrears incurred by the public sector 4 0 0 Met 0 … 0 Met 0 … 0 Met 0 … 0 Met 0 0 0 0<br />
Minimum increase in net international reserves of the Bank of Uganda 5 -225 -262 31 Met -281 -329 57 Met -150 -145 174 Met 41 41 31 Not Met 83 18 124 18<br />
(Percent)<br />
Share of oil revenue placed in the Petroleum Fund 100 100 Met 100 … 100 Met 100 … 100 Met 100 … 100 Met 100 100 100 100<br />
Indicative targets<br />
(Billions of Ugandan shillings)<br />
Ceiling on cumulative changes in temporary advances from Bank of<br />
Uganda to the central government 6 268 182 Met 118 … -60 Met 0 … 479 Not Met n.a. … n.a. n.a. n.a. -516 n.a. -726<br />
Floor on tax revenue 5,282 5,310 Met 7,997 … 7,851 Not Met 11,040 … 10,833 Not Met 2,756 … 2,695 Not Met 6,008 5,867 9,084 8,936<br />
Expenditures on poverty alleviating sectors 1,570 1,488 Not met 2,367 … 2,393 Met 3,032 … 3,241 Met 893 … 1,126 Met 1,824 1,824 2,782 2,782<br />
Ceiling on the issuance of guarantees by the Government/Bank of Uganda 0 0 Met 0 … 0 Met 0 … 0 Met 0 … 0 Met 0 0 0 0<br />
Net change in the stock of domestic arrears 7 -39 n.a. Not met -80 … n.a. n.a. -80 … n.a. n.a. n.a. … n.a. n.a. -62 -77 n.a. n.a.<br />
Ceiling on withdrawals from energy and petroleum funds 173 140 140 Met 253 253 144 Met n.a. … n.a. n.a. n.a. … n.a. n.a. n.a. n.a. n.a. n.a.<br />
(Annual percentage change)<br />
Inflation consultation clause<br />
Outer band (upper limit) 8.0 … … 8.0 … … 8.0 … … 8.0 … … 8.0 … 8.0 …<br />
Inner band (upper limit) 7.0 … … 7.0 … … 7.0 … … 7.0 … … 7.0 … 7.0 …<br />
Core inflation target 8 5.0 … 5.2 Met 5.0 … 6.3 Met 5.0 … 6.7 Met 5.0 … 6.4 Met 5.0 … 5.0 …<br />
Inner band (lower limit) 3.0 … … 3.0 … … 3.0 … … 3.0 … … 3.0 … 3.0 …<br />
Outer band (lower limit) 2.0 … … 2.0 … … 2.0 … … 2.0 … … 2.0 … 2.0 …<br />
1<br />
Defined in the Technical Memorandum of Understanding (TMU). Values for December 31, 2015, June 30, 2016, and December 31, 2016 are quantitative assessment criteria except as marked. Values for other dates are indicative targets.<br />
2 Proposed targets are measured as the change from June 2015, except as marked.<br />
3 Proposed targets are measured as the change from June 2016, except as marked.<br />
4<br />
Assessed on a continuous basis.<br />
5 The NIR outturn is assessed using program exchange rates.<br />
6<br />
As the issues regarding this target have been addressed by the Amendments to the PFM Act (2015), the target was set up until June 2016 but is now proposed to be continued at the seventh review.<br />
7<br />
The outturns are not available because a reconcilation process has not been completed yet. This target will be measured semiannually for quarters ending June 30 and December 31 since the seventh review.<br />
8 Annual percentage change, twelve-month period average core inflation.<br />
Proposed<br />
revised<br />
program<br />
Program<br />
Proposed<br />
revised<br />
program<br />
<strong>UGANDA</strong>
<strong>UGANDA</strong><br />
Policy Measure<br />
Ministry of Finance to submit<br />
to Parliament amendments<br />
to the Bank of Uganda Act<br />
containing provisions to<br />
support implementation of<br />
inflation targeting in line with<br />
international best practices,<br />
including establishing the<br />
capital of the BoU as an<br />
adequate percent of<br />
monetary liabilities, and<br />
limiting the size of intra-year<br />
advances to the government<br />
to 10 percent of tax revenues<br />
of the previous year.<br />
Table 1.2. Uganda: Structural Benchmarks<br />
Macroeconomic<br />
Rationale<br />
To strengthen monetary<br />
policy independence and<br />
credibility of the central<br />
bank.<br />
Date 1 Status Proposed<br />
Revised<br />
date<br />
September<br />
2016<br />
Not met.<br />
Draft Cabinet Memo on<br />
the Principles for<br />
Amending the BoU Act<br />
to be presented to<br />
Cabinet, thereafter, Bill<br />
to Parliament.<br />
Approval of Cabinet<br />
Memo pending.<br />
March 2017<br />
Ministry of Finance to<br />
publish reconciled reports<br />
signed by the PS/ST on the<br />
stock of unpaid bills of all<br />
government entities<br />
contained in the central<br />
government votes at end-<br />
December of each fiscal year.<br />
To facilitate control and<br />
reduction of unpaid bills.<br />
February<br />
15, 2016 for<br />
December<br />
2015 report<br />
Not met. Dropped<br />
because the authorities<br />
will no longer be able to<br />
publish a reconciled<br />
report on the stock of<br />
paid bills for<br />
December 2015 as the<br />
interim data are<br />
superseded by the endyear<br />
report.<br />
March 2017<br />
for December<br />
2016 report<br />
Ministry of Finance to<br />
publish reconciled reports<br />
signed by the PS/ST on the<br />
stock of domestic arrears of<br />
all government entities<br />
contained in the central<br />
government votes at end-<br />
June of each fiscal year.<br />
To facilitate control and<br />
reduction of unpaid bills<br />
and arrears.<br />
June 2016 for<br />
the June 2015<br />
report<br />
December<br />
2016 for the<br />
June 2016<br />
report<br />
Not met.<br />
Expected to be met<br />
December<br />
2016<br />
INTERNATIONAL MONETARY FUND 43
<strong>UGANDA</strong><br />
Table 1.2. Uganda: Structural Benchmarks (continued)<br />
Regulations for<br />
implementation of the PFM<br />
Act in line with international<br />
best practice to become<br />
effective.<br />
Ensure efficient PFM<br />
implementation and oil<br />
revenue management by<br />
providing guidelines,<br />
clarifying and making<br />
specific those aspects<br />
that are general in the<br />
law.<br />
June 2016<br />
Met.<br />
Instructions are being<br />
prepared to<br />
complement the<br />
Regulations—to be<br />
reviewed by the Fund.<br />
Ministry of Finance to send<br />
to Parliament the charter of<br />
fiscal responsibility.<br />
To improve fiscal and<br />
macroeconomic<br />
management.<br />
September<br />
2016<br />
Met. Sent to Parliament<br />
on August 18th.<br />
The Ministry of Finance to<br />
strengthen the AML/CFT<br />
framework in line with the<br />
international standard, and<br />
to liaise with Parliament to<br />
ensure the following: (i)<br />
amending the AML Act to<br />
give the FIA the sole<br />
authority to appoint its own<br />
staff, and enable the FIA and<br />
supervisory bodies to<br />
provide international<br />
cooperation to their foreign<br />
counterparts; (ii) amending<br />
the Capital Markets Authority<br />
Act and Insurance Regulatory<br />
Act to give regulators<br />
adequate supervisory powers<br />
to monitor compliance with<br />
AML/CFT obligations; and<br />
(iii) providing the legal basis<br />
and procedural mechanisms<br />
for the freezing of terrorist<br />
assets under UNSCR 1267<br />
and 1373.<br />
To strengthen the<br />
financial system<br />
safeguards<br />
June 2016<br />
Not met.<br />
Additional deficiencies<br />
(highlighted in the 2016<br />
Mutual Evaluation<br />
Report) are addressed<br />
by the Anti-Money<br />
Laundering<br />
(amendment) which has<br />
been tabled in<br />
Parliament. The<br />
Insurance Regulatory<br />
Authority (amendment)<br />
Bill was recently<br />
resubmitted to the First<br />
Parliamentary Council<br />
before being sent to the<br />
relevant Parliamentary<br />
Committee.<br />
December<br />
2016<br />
Ministry of Finance should<br />
finalize, publish and<br />
disseminate the Appraisal<br />
User Manual to all Ministries,<br />
Departments and Agencies.<br />
To provide guidelines<br />
and procedures for<br />
undertaking a project<br />
through each stage of<br />
the project cycle.<br />
December<br />
2016<br />
Expected to be met.<br />
Status: Second draft of<br />
the manual is<br />
undergoing consultative<br />
review. Once comments<br />
from this process are<br />
incorporated, the<br />
manual will be published<br />
and disseminated.<br />
44 INTERNATIONAL MONETARY FUND
<strong>UGANDA</strong><br />
Table 1.2. Uganda: Structural Benchmarks (concluded)<br />
Ministry of Finance should<br />
update and publish<br />
Development Committee<br />
guidelines to ensure<br />
compliance with the<br />
Appraisal User Manual.<br />
To promote compliance<br />
with the Appraisal User<br />
Manual.<br />
December<br />
2016<br />
Expected to be met.<br />
The guidelines are being<br />
aligned to the manual.<br />
Proposed new structural benchmarks<br />
Ministry of Finance to further<br />
strengthen the AML/CFT<br />
framework in line with the<br />
international standard by<br />
liaising with Parliament to<br />
amend the Anti-Terrorism<br />
Act to adequately criminalize<br />
the financing of terrorism.<br />
To facilitate the speedy<br />
tracing, identification<br />
and freezing of terrorist<br />
assets, helping to secure<br />
Uganda’s timely exit<br />
from the FATF Gray list.<br />
December 20<br />
16<br />
The Amended Anti-<br />
Terrorism Act has been<br />
sent to Parliament for its<br />
approval.<br />
Ministry of Finance to<br />
establish a framework for<br />
following up and reporting<br />
on the implementation of the<br />
recommendations of valuefor-money<br />
audits conducted<br />
by the Auditor General’s<br />
office.<br />
To improve public<br />
investment efficiency.<br />
March 2017<br />
Ministry of Finance and BoU<br />
to prepare and submit to<br />
Cabinet a policy to regulate<br />
mobile money banking.<br />
To strengthen financial<br />
sector oversight and<br />
consumer protection<br />
April 2017<br />
Ministry of Finance to<br />
produce a manual setting out<br />
national parameters, shadow<br />
prices and conversion factors<br />
to be used in all economic<br />
project appraisals prior to<br />
admission into the Public<br />
Investment Plan.<br />
To improve public<br />
investment efficiency.<br />
March 2017<br />
1<br />
All dates refer to the end of the month, unless otherwise specified.<br />
INTERNATIONAL MONETARY FUND 45
<strong>UGANDA</strong><br />
Attachment II. Technical Memorandum of Understanding<br />
INTRODUCTION<br />
1. This memorandum defines the quarterly quantitative assessment criteria (QAC) and<br />
indicative targets (ITs) described in the Memorandum of Economic and Financial Policies (MEFP)<br />
for the economic program supported by the IMF Policy Support Instrument (PSI) over the period<br />
of December 31, 2016—March 31, 2017, and sets forth the reporting requirements under the<br />
instrument. The stock of all foreign assets and liabilities will be converted into U.S. dollars at each<br />
test date using the cross exchange rates referred to in text table 1 below for the various<br />
currencies, and then converted into Uganda shillings using the program U.S. dollar-Uganda<br />
shilling exchange rate for end-September 2016, unless otherwise indicated in the text.<br />
46 INTERNATIONAL MONETARY FUND<br />
Text Table 1. Program Exchange Rates (end-September 2016) 1<br />
US Dollar (US$) 1<br />
Chinese Yuan/US$ 6.6704<br />
British Pound/US$ 0.77155<br />
Japanese Yen/US$ 101.08<br />
SDR/US$ 0.71643<br />
Kenyan Shilling/US$ 101.25<br />
Tanzania Shillings/US$ 2,182.0<br />
Euro/US$ 0.89598<br />
Canadian dollar/US$ 1.3117<br />
Australian dollar/US$ 1.3106<br />
Ugandan Shillings/US$ 3,381.41<br />
1<br />
For the currencies not listed in this table, the cross exchange rates to<br />
the U.S. dollar at end-September 2016 will be applied.<br />
CONSULTATION MECHANISM ON INFLATION (QAC)<br />
2. The quarterly consultation bands for the twelve-month average rate of consumer price<br />
inflation (as measured by the core consumer price index (CCPI) published by the Uganda Bureau<br />
of Statistics (UBOS)) are specified in Text Table 2. The consultation bands specify the range of<br />
admissible CCPI inflation. Observed CCPI inflation for end-December 2016 will be subject to the<br />
consultation mechanism, while the CCPI inflation for end-March 2017 will be an indicative target.<br />
Text Table 2. Inflation Targets<br />
Dec. 2016 Mar. 2017<br />
Outer band (upper limit) 8.0 8.0<br />
Inner band (upper limit) 7.0 7.0<br />
Core inflation target 5.0 5.0<br />
Inner band (lower limit) 3.0 3.0<br />
Outer band (lower limit) 2.0 2.0<br />
3. Should the observed average CCPI inflation for the test date linked to a PSI program<br />
review (i.e., end-December 2016 for the eighth review) fall outside the outer band as specified in<br />
the above table, the authorities will complete a consultation with the Executive Board of the Fund
<strong>UGANDA</strong><br />
on their proposed policy response before requesting completion of the review under the<br />
program. The authorities will not be able to request completing a review under the PSI-supported<br />
program if the average CCPI inflation has moved outside of the outer band as of the test date<br />
linked to such review, until the consultation with the Executive Board has taken place. In line with<br />
the accountability principles, the BoU will report to the public the reasons for any breach of the<br />
outer bands, and its policy response. In addition, the BoU will conduct discussions with Fund staff<br />
when the observed average CCPI inflation falls outside the inner band, as specified for<br />
December 2016 in Text Table 2.<br />
CEILING ON OVERALL DEFICIT OF THE CENTRAL<br />
GOVERNMENT 1 (QAC)<br />
4. The QAC on the ceiling on the overall deficit of the central government is defined as the<br />
cumulative sum, from the beginning of the relevant fiscal year, of:<br />
a. net domestic financing (NDF) as defined below;<br />
b. net external financing (NEF), defined as the sum of the difference between disbursements<br />
and amortization of any loans (including budget support loans and project loans, both<br />
concessional and non-concessional), internationally-issued bonds, and any other forms of<br />
liabilities by the Central Government to nonresidents, excluding nonresidents’ holdings of<br />
domestically-issued government securities (which are covered under NDF), plus external<br />
exceptional financing; and<br />
c. net proceeds from sales of non-financial assets including privatization receipts.<br />
5. The NDF of the central government is defined from below the line on a cash basis as the<br />
sum of:<br />
a. the change in net claims on the central government by the banking system: Net claims on<br />
the central government by the banking system is defined as the difference between the<br />
outstanding amount of bank credits to the central government and the central<br />
government's deposits, excluding deposits in the Energy and Petroleum Funds and project<br />
accounts with the banking system and the central bank. Credits comprise bank loans and<br />
advances to the government and holdings of government securities and promissory<br />
notes.<br />
b. the change in net claims on the central government of domestic nonbank institutions and<br />
households: net claims on the central government of domestic nonbank institutions and<br />
households are defined as treasury bills, bonds or other government securities held by<br />
nonbank institutions and households (including nonresident individuals and nonresident<br />
financial institutions), plus any other liabilities of the central government to domestic<br />
nonbank institutions or households.<br />
1<br />
The central government comprises the treasury and line ministries.<br />
INTERNATIONAL MONETARY FUND 47
<strong>UGANDA</strong><br />
All changes will be calculated as the difference between end-of-period stocks, net of any<br />
valuation changes resulting from currency movements. NDF will be calculated based on data from<br />
balance sheets of the monetary authority and deposit corporations and government liabilities to<br />
nonbank institutions and households as per the deposit corporations’ survey (DCS).<br />
6. Changes in NEF will be measured using external financing (net) provided in the monthly<br />
government financial statistics. These data, in turn, will be based on the reconciled donor<br />
disbursement figures obtained by the central bank and by Ministry of Finance, Planning, and<br />
Economic Development (MoFPED) through the Debt Management and Financial Analysis System<br />
(DMFAS) and Aid Management System (AMS).<br />
FLOOR ON THE NET INTERNATIONAL RESERVES OF THE BANK OF<br />
<strong>UGANDA</strong> (QAC)<br />
7. Net international reserves (NIR) of the Bank of Uganda are defined for programmonitoring<br />
purposes as reserve assets of the BoU net of short-term external liabilities of the BoU.<br />
Reserve assets are defined as external assets readily available to, and controlled by, the BoU and<br />
exclude pledged or otherwise encumbered external assets, including, but not limited to, assets<br />
used as collateral or guarantees for third-party liabilities. Short-term external liabilities are defined<br />
as liabilities to nonresidents, of original maturities less than one year, contracted by the BoU and<br />
include outstanding IMF purchases and loans.<br />
8. For program-monitoring purposes, reserve assets and short-term liabilities at the end of<br />
each test period will be calculated in U.S. dollars by converting the stock from their original<br />
currency denomination at program exchange rates (as specified in text table 1). The NIR limits are<br />
the cumulative changes of the NIR stock from the beginning of the respective fiscal year to the<br />
specified dates.<br />
SHARE OF OIL REVENUE PLACED IN PETROLEUM FUND (QAC)<br />
9. The purpose of this QAC is to avoid a situation whereby petroleum revenues bypass the<br />
Ugandan budget framework. The 2015 PFM Act has established a petroleum fund, and<br />
government has established a petroleum revenue account in the BoU. This QAC will be deemed<br />
satisfied if 100 percent of any kind of petroleum-related revenues (even before the start of oil<br />
production) is transferred to this account upon collection by URA. These resources may then be<br />
spent or saved as governed by the 2015 PFM Act.<br />
CEILING ON CUMULATIVE CHANGES IN TEMPORARY ADVANCES<br />
FROM THE BANK OF <strong>UGANDA</strong> TO THE CENTRAL GOVERNMENT (IT)<br />
Purpose, definition, and measurement of this indicative target<br />
10. The purpose of the indicative target on the ceiling on cumulative changes in temporary<br />
advances from the BoU to the central government is to help define and monitor the balance of<br />
48 INTERNATIONAL MONETARY FUND
<strong>UGANDA</strong><br />
outstanding temporary advances and ensure their prompt repayment. This should help reduce the<br />
likelihood of a situation where the temporary advances are used in order to bypass issuances of<br />
treasury securities in the domestic financial market, resulting in monetization of fiscal deficits and<br />
potential inflationary pressures. The cumulative change in temporary advances from the BoU to<br />
the central government is defined as the cumulative change, from the beginning of the respective<br />
fiscal year, in adjusted net claims on the central government by the BoU. The adjusted net claims<br />
on the central government by the BoU is defined as the difference between the outstanding<br />
amount of BoU credit to the central government and the central government's deposits, excluding<br />
deposits in administered accounts (including the energy and petroleum funds), project accounts<br />
with the central bank, and net recapitalization securities (recapitalization securities provided to the<br />
central bank less those used for monetary policy purposes). Credits comprise BoU loans and<br />
advances to the government and holdings of government securities and promissory notes.<br />
11. The cumulative change in temporary advances from the BoU to the central government<br />
will be calculated based on data from balance sheets of the monetary authority as per the DCS.<br />
FLOOR ON EXPENDITURES ON POVERTY ALLEVIATING SECTORS (IT)<br />
12. The indicative target on the floor on poverty alleviating expenditures includes domestic<br />
expenditures inclusive of wages and salaries in the Health, Education, Water and Environment and<br />
Agriculture sectors, as defined by the Government of Uganda functional budget classification,<br />
excluding those which are externally financed. Compliance with the indicative floor for poverty<br />
alleviating expenditures will be verified on the basis of releases.<br />
CEILING ON ISSUANCE OF GUARANTEES BY THE GOVERNMENT OR<br />
BANK OF <strong>UGANDA</strong> (IT)<br />
13. The indicative target on issuance of guarantees by the GoU or the BoU aims to prevent<br />
accumulation of contingent liabilities by the GoU (including entities such as ministries, agencies<br />
and authorities). Included against the ceiling are any direct, contingent liabilities of the GoU<br />
(including entities that are part of the GoU such as ministries, agencies and authorities). This<br />
excludes guarantee programs which have explicit budget appropriations.<br />
TAX REVENUE (IT)<br />
14. A floor applies on tax revenue of the central government measured cumulatively from<br />
the beginning of the fiscal year. For program-monitoring purposes, tax revenue is defined as the<br />
sum of direct domestic taxes (PAYE, corporate tax, presumptive tax, other direct taxes,<br />
withholding tax, rental income tax, tax on bank interest, casino tax and unallocated receipts);<br />
excise duty and value-added taxes net of refunds; infrastructure levy; and taxes on international<br />
trade minus temporary road licenses and fees to hides and skins, as defined by the GoU’s revenue<br />
classification.<br />
INTERNATIONAL MONETARY FUND 49
<strong>UGANDA</strong><br />
NET ACCUMULATION OF DOMESTIC ARREARS OF THE<br />
GOVERNMENT (IT)<br />
15. A ceiling applies to net accumulation of domestic arrears of the central government as an<br />
indicative target. A negative target thus represents a floor on net repayment. The ceiling for each<br />
test date is measured cumulatively from the beginning of the respective fiscal year.<br />
16. An unpaid bill is defined as any verified outstanding payment owed by any entity that<br />
forms part of the central government votes for the following: utilities, rent, employee costs, other<br />
recurrent, court awards, compensation, contributions to international organizations, development,<br />
taxes, and other deductions. Domestic arrears are the total stock of unpaid bills as of June 30 of<br />
the fiscal year as reported in the consolidated financial statements of the GoU.<br />
17. This indicative target will be observed on a semi-annual basis. For the quarter ending<br />
December 31, the net change in the stock of unpaid bills as reported in the semi-annual report on<br />
domestic arrears will be used as the indicative target.<br />
ADJUSTORS<br />
18. The NIR and the overall deficit targets are based on program assumptions regarding:<br />
(A) budget support excluding assistance provided under the Heavily Indebted Poor Countries<br />
(HIPC) Initiative and the MDRI; (B) net inflows into the Petroleum Fund; (C) recapitalization of the<br />
BoU; (D) external financing tied to projects. and (E) Other recapitalization.<br />
Adjustor related to budget support<br />
The Uganda shilling equivalent of projected budget support (grants and loans) excluding HIPC<br />
Initiative and MDRI assistance in the form of grants on a cumulative basis from the beginning of<br />
the relevant fiscal year is presented under Schedule A. The floor on the cumulative increase in<br />
NIR of the BoU will be adjusted upward (downward) by the amount by which budget support,<br />
grants and loans, excluding HIPC Initiative and MDRI assistance, exceeds (falls short of) the<br />
projected amounts. The ceilings on the cumulative increase in overall deficit will be adjusted<br />
downward (upward) by the amount by which budget support grants, excluding HIPC Initiative<br />
and MDRI assistance, exceeds (falls short of) the projected amounts.<br />
50 INTERNATIONAL MONETARY FUND
<strong>UGANDA</strong><br />
Schedule A: Budget Support 1<br />
(Ush billions; cumulative from the beginning of the respective fiscal year)<br />
Jun-16 Sep-16 Dec-16 Mar-17<br />
Budget support grants 110 4 19 47<br />
Budget support loans 0 0 0 0<br />
1 Budget support loans and grants excluding HIPC initiative and MDRI assistance.<br />
Adjustor on Inflows into the Petroleum Fund<br />
19. The ceilings on the cumulative increase in overall deficit will be adjusted upward<br />
(downward) by the amount by which inflows into the Petroleum Fund (excluding valuation<br />
changes) falls short of (exceeds) the projected amounts as set out in Schedule B.<br />
Schedule B: Inflows into Petroleum Fund<br />
(Ush billions; cumulative from the beginning of the respective fiscal year)<br />
Jun-16 Sep-16 Dec-16 Mar-17<br />
125 0 0 0<br />
Adjustor related to BoU Recapitalization<br />
20. The ceilings on overall deficit will be adjusted upward (downward) by the amount by<br />
which the recapitalization of the BoU exceeds (falls short of) the projected amounts as set out in<br />
Schedule C.<br />
Schedule C: Recapitalization of the Bank of Uganda<br />
(Ush billions; cumulative from the beginning of the respective fiscal year)<br />
Jun-16 Sep-16 Dec-16 Mar-17<br />
200 350 100 100<br />
Adjustor related to externally financed projects<br />
21. The ceiling on overall deficit will be adjusted downward (upward) by the amount by<br />
which (both concessional and non-concessional) external financing tied to projects falls short of<br />
(exceeds) the projected amounts as set out in Schedule D. Any upward adjustment will be capped<br />
by 10 percent of the amounts set out in Schedule D.<br />
Schedule D: External Financing Tied to Projects<br />
(Ush billions; cumulative from the beginning of the respective fiscal year)<br />
Jun-16 Sep-16 Dec-16 Mar-17<br />
4,356 1,018 3130 4318<br />
INTERNATIONAL MONETARY FUND 51
<strong>UGANDA</strong><br />
Adjustor related to other recapitalization<br />
22. The ceilings on overall deficit will be adjusted upward (downward) by the amount by<br />
which spending on recapitalization (excluding recapitalization of the BoU) exceeds (falls short of)<br />
the projected amounts as set out in Schedule E.<br />
Schedule E: Other Recapitalization (excluding Bank of Uganda)<br />
(Ush billions; cumulative from the beginning of the respective fiscal year)<br />
Jun-16 Sep-16 Dec-16 Mar-17<br />
0 0 200 200<br />
CEILING ON THE ACCUMULATION OF NEW EXTERNAL PAYMENTS<br />
ARREARS INCURRED BY THE PUBLIC SECTOR 2<br />
23. The definition of debt, for the purposes of the ceiling, is set out in point 8 of the<br />
Guidelines on Public Debt Conditionality in Fund Arrangements (Executive Board Decision<br />
No 6230–(79/140), as amended by Decision No. 15688–(14/107), effective June 30, 2015). It not<br />
only applies to the debt as defined in point 8 of the Executive Board decision, but also to<br />
commitments contracted or guaranteed for which value has not been received. The definition of<br />
debt set forth in point 8 of the Guidelines on Public Debt Conditionality in Fund Arrangements<br />
reads as follows:<br />
(a) For the purpose of this guideline, the term "debt" will be understood to mean<br />
a current, i.e., not contingent, liability, created under a contractual arrangement<br />
through the provision of value in the form of assets (including currency) or<br />
services, and which requires the obligor to make one or more payments in the<br />
form of assets (including currency) or services, at some future point(s) in time;<br />
these payments will discharge the principal and/or interest liabilities incurred<br />
under the contract. Debts can take a number of forms, the primary ones being as<br />
follows: (i) loans, i.e., advances of money to the obligor by the lender made on<br />
the basis of an undertaking that the obligor will repay the funds in the future<br />
(including deposits, bonds, debentures, commercial loans and buyers' credits)<br />
and temporary exchanges of assets that are equivalent to fully collateralized<br />
loans under which the obligor is required to repay the funds, and usually pay<br />
interest, by repurchasing the collateral from the buyer in the future (such as<br />
repurchase agreements and official swap arrangements); (ii) suppliers' credits, i.e.,<br />
2<br />
Public sector comprises the general government (which includes the central government, local governments, and<br />
monetary authorities), and entities that are public corporations which are subject to ‘control by the government’,<br />
defined as the ability to determine general corporate policy or by at least 50 percent government ownership.<br />
52 INTERNATIONAL MONETARY FUND
<strong>UGANDA</strong><br />
contracts where the supplier permits the obligor to defer payments until<br />
sometime after the date on which the goods are delivered or services are<br />
provided; and (iii) leases, i.e., arrangements under which property is provided<br />
which the lessee has the right to use for one or more specified period(s) of time<br />
that are usually shorter than the total expected service life of the property, while<br />
the lesser retains the title to the property. For the purpose of the guideline, the<br />
debt is the present value (at the inception of the lease) of all lease payments<br />
expected to be made during the period of the agreement excluding those<br />
payments that cover the operation, repair, or maintenance of the property.<br />
(b) Under the definition of debt set out in point 8(a) above, arrears, penalties, and<br />
judicially awarded damages arising from the failure to make payment under a<br />
contractual obligation that constitutes debt. Failure to make payment on an<br />
obligation that is not considered debt under this definition (e.g., payment on<br />
delivery) will not give rise to debt.<br />
24. The ceiling on the accumulation of new external payments arrears is zero. This<br />
limit, which is to be observed on a continuous basis, applies to the change in the stock of<br />
overdue payments on debt contracted or guaranteed by the public sector from their level at<br />
end-June 2016. For the purpose on monitoring compliance with the PC on the non-accumulation<br />
of external arrears, external arrears are obligations (reported by the Statistics Department of the<br />
BoU, the Macro Department of the Ministry of Finance) that have not been paid on the due date<br />
(taking into account the contractual grace periods, if any) but shall exclude arrears on obligations<br />
subject to rescheduling. External payments arrears on external debt service obligations in<br />
respect of public private partnership projects (which are defined as infrastructure projects which<br />
involve the (i) granting of a government guarantee and the (ii) participation of a public<br />
corporation subject to control by the government) are not included in the coverage of this<br />
external arrears AC, unless these external payment arrears are overdue (under the terms of the<br />
contracts including any grace periods) by more than 30 days.<br />
MONITORING AND REPORTING REQUIREMENTS<br />
25. The GoU will submit information to IMF staff with the frequency and submission time lag<br />
as indicated in Table 1. The quality and timeliness of the data submission will be tracked and<br />
reported by IMF staff. The information should be mailed electronically to afruga@imf.org.<br />
INTERNATIONAL MONETARY FUND 53
<strong>UGANDA</strong><br />
Attachment Table II.1. Summary of Reporting Requirements<br />
Reporting<br />
institution<br />
Report/Table<br />
Submission<br />
Frequency<br />
Submission<br />
Lag<br />
I. Bank of<br />
Uganda<br />
Issuance of government securities, repurchase operations and<br />
reverse repurchase operations.<br />
Weekly 5 working<br />
days<br />
Operations in the foreign exchange market and the level of the<br />
BoU‘s international reserves.<br />
Weekly 5 working<br />
days<br />
Interest rates (7 day interbank, commercial bank prime lending<br />
rate, government securities).<br />
Weekly 5 working<br />
days<br />
Private sector credit growth by shilling and forex, and excess<br />
reserves of commercial banks.<br />
Monthly 5 working<br />
days<br />
Disaggregated consumer price index. Monthly 2 weeks<br />
Balance sheet of the BoU, consolidated accounts of the<br />
Monthly 4 weeks<br />
commercial banks, and depository corporations’ survey.<br />
Monthly balances of net foreign assets, net domestic assets, and Monthly 4 weeks<br />
base money of the BoU.<br />
Details on the government position at the central bank including Monthly 4 weeks<br />
deposits broken down by i) net public debt, ii) government<br />
project accounts, iii) Petroleum Fund (specifying the currency),<br />
iv) Energy Fund, v) government ministries accounts, and the<br />
remainder in vi) other deposits. In addition, liabilities broken<br />
down by i) appropriation account (UCF), ii) other drawdown<br />
accounts, iii) government securities accounts and the remainder<br />
in iv) other liabilities. Detailed information about the recording of<br />
the recapitalization of the BoU.<br />
Monthly foreign exchange cash flow table of BoU. Quarterly 4 weeks<br />
Statement of (i) cash balances held in project accounts at Quarterly 6 weeks<br />
commercial banks; (ii) total value (measured at issue price) of<br />
outstanding government securities from the Central Depository<br />
System (CDS); and (iii) the stock of government securities<br />
(measured at issue price) held by commercial banks from the<br />
CDS.<br />
Summary of (i) monthly commodity and direction of trade Quarterly 6 weeks<br />
statistics; (ii) disbursements, principal and interest, flows of debt<br />
rescheduling and debt cancellation, arrears, and committed<br />
undisbursed balances—by creditor category; and<br />
(iii) composition of nominal HIPC Initiative assistance.<br />
Summary of stock of external debt, external arrears, and<br />
Quarterly 6 weeks<br />
committed undisbursed loan balances by creditor.<br />
Standard off-site bank supervision indicators for deposit money Quarterly 4 weeks<br />
banks.<br />
Summary table of preliminary program performance comparing<br />
actual outcome with adjusted program targets for (i) net claims<br />
on central government by the banking system; (ii) new nonconcessional<br />
external borrowing; and (iii) net international<br />
reserves.<br />
Quarterly 6 weeks<br />
54 INTERNATIONAL MONETARY FUND
<strong>UGANDA</strong><br />
Attachment Table II.1. Summary of Reporting Requirements (concluded)<br />
Currency composition of the BoU’s international reserves in unit<br />
of each currency at each end of quarter.<br />
Quarterly<br />
6 weeks<br />
II. Ministry of Summary of central government accounts. Revenues shall be Monthly 4 weeks<br />
Finance<br />
recorded on a cash basis, with a breakdown including<br />
infrastructure levy. Expenditures shall be recorded when checks<br />
are issued, except for domestic and external debt-service<br />
payments 1 , cash transfers to districts, and externally funded<br />
development expenditures. Expenditures on domestic interest<br />
will be recorded on an accrual basis and external debt service will<br />
be recorded on a commitment basis (i.e., when payment is due).<br />
Summary of the stock of arrears (or unpaid bills) by government Semi-annually 3 months<br />
entities contained in the central government votes as reported<br />
by the Accountant General and signed by the PS/ST.<br />
Summary of contingent liabilities of the central government and Quarterly 6 weeks<br />
the BoU. For the purpose of the program, contingent liabilities<br />
include all borrowings by statutory bodies, government<br />
guarantees, claims against the government in court cases that<br />
are pending, or court awards that the government has appealed.<br />
Detailed monthly central government account of disbursed Quarterly 4 weeks<br />
budget support and project grants and loans (less change in the<br />
stock of project accounts held at the BoU and commercial<br />
banks), HIPC support, and external debt service due and paid.<br />
Detailed central government account of disbursed donor project Monthly 6 weeks<br />
support grants and loans.<br />
Statement on new external loans contracted or guaranteed by Quarterly 6 weeks<br />
the central government and the BoU during the period according<br />
to loan agreements. Parliament resolutions on any new loans.<br />
Updated national accounts statistics (real and nominal) according Quarterly 12 weeks<br />
to UBOS and medium-term projections.<br />
Releases of domestic expenditures on wages and salaries in the Quarterly 6 weeks<br />
Health, Education, Water and Environment and Agriculture<br />
sectors, as defined by the Government of Uganda’s functional<br />
budget classification, with a breakdown based on financing<br />
(domestically financed or externally financed).<br />
1.<br />
The budget records domestic interest payments on cash-basis while for program purposes this entry will be reported on an accrual<br />
basis.<br />
INTERNATIONAL MONETARY FUND 55
December 16, 2016<br />
<strong>UGANDA</strong><br />
SEVENTH REVIEW UNDER THE POLICY SUPPORT<br />
INSTRUMENT—INFORMATIONAL ANNEX<br />
Prepared By<br />
The African Department<br />
(in consultation with other departments)<br />
CONTENTS<br />
FUND RELATIONS _____________________________________________________________________ 2<br />
JOINT WORLD BANK-IMF WORK PROGRAM ________________________________________ 6<br />
STATISTICAL ISSUES ___________________________________________________________________ 9
<strong>UGANDA</strong><br />
FUND RELATIONS<br />
Uganda: Financial Position in the Fund as of September 30, 2016<br />
Summary of IMF members’ quota, reserve tranche position, SDR holdings, outstanding credit,<br />
recent lending arrangements, projected payments due to the IMF, and historical transactions with<br />
the IMF.<br />
Membership Status: Joined: September 27, 1963;<br />
Article VIII<br />
General Resources Account: SDR Million %Quota<br />
Quota 361.00 100.00<br />
IMF's Holdings of Currency (Holdings Rate) 361.01 100.00<br />
Reserve Tranche Position 0.00 0.00<br />
SDR Department: SDR Million %Allocation<br />
Net cumulative allocation 173.06 100.00<br />
Holdings 47.22 27.28<br />
Outstanding Purchases and Loans: None<br />
Latest Financial Arrangements:<br />
Date of Expiration Amount Approved Amount Drawn<br />
Type Arrangement Date (SDR Million) (SDR Million)<br />
ECF 1 Sep 13, 2002 Jan 31, 2006 13.50 13.50<br />
ECF Nov 10, 1997 Mar 31, 2001 100.43 100.43<br />
ECF Sep 06, 1994 Nov 17, 1997 120.51 120.51<br />
Overdue Obligations and Projected Payments to Fund 2<br />
(SDR Million; based on existing use of resources and present holdings of SDRs):<br />
Forthcoming<br />
2016 2017 2018 2019 2020<br />
Principal<br />
Charges/Interest 0.02 0.07 0.07 0.07 0.07<br />
Total 0.02 0.07 0.07 0.07 0.07<br />
Implementation of HIPC Initiative:<br />
Original Enhanced<br />
Commitment of HIPC assistance Framework Framework Total<br />
Decision point date Apr 1997 Feb 2000<br />
1<br />
Formerly PRGF.<br />
2<br />
When a member has overdue financial obligations outstanding for more than three months, the amount of such<br />
arrears will be shown in this section.<br />
(continued)<br />
2 INTERNATIONAL MONETARY FUND
<strong>UGANDA</strong><br />
Assistance committed<br />
by all creditors (US$ Million) 3 347.00 656.00<br />
Of which: IMF assistance (US$ million) 68.90 91.00<br />
(SDR equivalent in millions) 51.51 68.10<br />
Completion point date Apr 1998 May 2000<br />
Disbursement of IMF assistance (SDR Million)<br />
Assistance disbursed to the member 51.51 68.10 119.61<br />
Interim assistance -- 8.20 8.20<br />
Completion point balance 51.51 59.90 111.41<br />
Additional disbursement of interest income 4 -- 2.06 2.06<br />
Total disbursements 51.51 70.16 121.67<br />
Implementation of Multilateral Debt Relief Initiative (MDRI):<br />
MDRI-eligible debt (SDR Million) 5 87.73<br />
Financed by: MDRI Trust 75.85<br />
Remaining HIPC resources 11.88<br />
Debt Relief by Facility (SDR Million)<br />
Eligible Debt<br />
Delivery<br />
Date GRA PRGT Total<br />
January 2006 N/A 87.73 87.73<br />
Implementation of Catastrophe Containment and Relief (CCR): Not Applicable<br />
As of February 4, 2015, the Post-Catastrophe Debt Relief Trust has been transformed to the<br />
Catastrophe Containment and Relief (CCR) Trust.<br />
_________________<br />
Decision point - point at which the IMF and the World Bank determine whether a country qualifies<br />
for assistance under the HIPC Initiative and decide on the amount of assistance to be committed.<br />
3<br />
Assistance committed under the original framework is expressed in net present value (NPV) terms at the<br />
completion point, and assistance committed under the enhanced framework is expressed in NPV terms at the<br />
decision point. Hence these two amounts cannot be added.<br />
4<br />
Under the enhanced framework, an additional disbursement is made at the completion point corresponding to<br />
interest income earned on the amount committed at the decision point but not disbursed during the interim period.<br />
5<br />
The MDRI provides 100 percent debt relief to eligible member countries that qualified for the assistance. Grant<br />
assistance from the MDRI Trust and HIPC resources provide debt relief to cover the full stock of debt owed to the<br />
Fund as of end-2004 that remains outstanding at the time the member qualifies for such debt relief.<br />
INTERNATIONAL MONETARY FUND 3
<strong>UGANDA</strong><br />
Interim assistance - amount disbursed to a country during the period between decision and<br />
completion points, up to 20 percent annually and 60 percent in total of the assistance committed at<br />
the decision point (or 25 percent and 75 percent, respectively, in exceptional circumstances).<br />
Completion point - point at which a country receives the remaining balance of its assistance<br />
committed at the decision point, together with an additional disbursement of interest income as<br />
defined in footnote 2 above. The timing of the completion point is linked to the implementation of<br />
pre-agreed key structural reforms (i.e., floating completion point).<br />
Prepared by Finance Department<br />
Safeguards Assessments:<br />
Under the Fund's safeguards policy, assessments with respect to the PSI are voluntary. An update<br />
assessment of the Bank of Uganda (BOU) was completed on April 10, 2007 and concluded that the<br />
BOU had strengthened its safeguards framework since the 2003 assessment. The main achievements<br />
included implementation of international financial reporting standards, publication of financial<br />
statements, establishment of an audit committee, and strengthening of the internal audit function.<br />
Staff recommended addressing remaining vulnerabilities in the legal and internal control areas.<br />
Exchange Rate Arrangement:<br />
The official exchange rate is determined on the interbank market for foreign exchange. Uganda’s<br />
de jure exchange rate arrangement is free floating. The authorities intervene in Uganda’s foreign<br />
exchange market when short-term fluctuations jeopardize its orderly operation. Therefore, the<br />
de facto exchange rate arrangement is classified as floating. As of end-October, 2016, the official<br />
exchange rate was USh 3463.44 per U.S. dollar. The exchange system is free of restrictions on the<br />
making of payments and transfers for current international transactions, and there are currently no<br />
multiple currency practices.<br />
Article IV Consultation:<br />
The Executive Board concluded the last Article IV consultation on June 29, 2015. The next Article IV<br />
consultation will be held in accordance with the decision on consultation cycles adopted by Decision<br />
No. 14747, as amended.<br />
Technical Assistance:<br />
Uganda has continued to receive extensive technical assistance from both IMF and East AFRITAC<br />
(regional technical assistance center). 6 Key areas of assistance include PFM, revenue mobilization,<br />
6<br />
For a description of technical assistance provided prior to November 2016, see the staff report for Uganda: Sixth<br />
Review Under the Policy Support Instrument (IMF Country Report No. 16/145). Refer to the staff report for Uganda<br />
First Review Under the Policy Support Instrument (IMF Country Report No. 13/375) for the details on technical<br />
assistance for the second half of 2013; to the staff report for Uganda Second Review Under the Policy Support<br />
Instrument (IMF Country Report No. 14/195) for the details on technical assistance for the first half of 2014; to the<br />
Third Review Under the Policy Support Instrument (IMF Country Report No. 14/344) for the details on technical<br />
assistance for the second half of 2014; to the 2015 Article IV Consultation and Fourth Review Under the Policy<br />
Support Instrument (IMF Country Report No. 15/175) for technical assistance for the first half of 2015; and to the staff<br />
(continued)<br />
4 INTERNATIONAL MONETARY FUND
<strong>UGANDA</strong><br />
mining and oil resource management, and international taxation on the fiscal side. MCM and East<br />
AFRITAC have been providing a series of missions focusing on financial stability since the beginning<br />
of 2014, covering a wide range of areas, including insurance company supervision, mobile payment<br />
regulation, payment systems, and oversight policy.<br />
In the fiscal area, following the series of missions in March and April 2016, led by East AFRITAC to<br />
collect information related to budget transparency, an FAD mission was held in May 2016 to<br />
conduct a Fiscal Transparency Evaluation (FTE). A follow-up FTE mission is scheduled for early<br />
FY2017/18. Other TA missions in the fiscal area focused on: cash management (June and October<br />
2016), strengthening the medium-term budget framework (August 2016), national training in<br />
developing a compliance risk analysis tool (August 2016) and on developing an operational model<br />
and strategy for recruiting taxpayers from the informal sector (October 2016).<br />
An East AFRITAC technical assistance mission in November 2016 assisted the BoU to strengthen its<br />
oversight responsibilities for financial market infrastructure. Another East AFRITAC mission in May<br />
2016 assisted the BoU with recommendations to help developing the REPO market.<br />
In the area of National Accounts, East AFRITAC fielded a mission in October 2016 in support of the<br />
development of the planned rebasing of GDP estimates. The mission assisted with the development<br />
of quarterly estimates of gross fixed capital formation for the public and private sectors, in both<br />
current and constant prices, and assisted the Uganda Bureau of Statistics (UBOS) to formulate a plan<br />
for integrating the current annual and quarterly systems for estimating GDP.<br />
East AFRITAC also conducted a regional workshop on developing a compliance risk analysis tool in<br />
October 2016 in Kampala, to provide participants with the knowledge and tools for strengthening<br />
compliance risk management frameworks. The project was undertaken within the context of the AFE<br />
ongoing project on Improving Risk Assessment and Management Capacity in Revenue<br />
Administration. Other regional workshops included as part of this project included a Regional<br />
Workshop on Operationalizing Risk Management in Customs, designed to enhance customs<br />
administration through strengthened customs risk management.<br />
Resident Representative:<br />
The Fund has maintained a resident representative in Uganda since July 1982. Currently, the<br />
Resident Representative is Ms. Clara Mira.<br />
report for Uganda: Fifth Review Under the Policy Support Instrument (IMF Country Report No. 15/321) for the details<br />
on technical assistance through February 2016.<br />
INTERNATIONAL MONETARY FUND 5
<strong>UGANDA</strong><br />
JOINT WORLD BANK-IMF WORK PROGRAM<br />
Title Products Provisional<br />
Timing of<br />
Missions (if<br />
relevant)<br />
World Bank<br />
The current portfolio consists of 18 national<br />
projects with a net commitment of $2.2 billion<br />
in IDA credits and grants, and another<br />
$255 million in IDA credits for 7 regional<br />
projects. In line with the national<br />
development agenda, roughly half of the<br />
portfolio is supporting infrastructure<br />
investments in energy, roads, urban<br />
development, and ICT. Other key sectors<br />
include agriculture, water, urban<br />
development, education, health, and private<br />
sector competitiveness.<br />
Expected<br />
Delivery Dates<br />
In the near term, the Bank took a decision to<br />
withhold new lending to Uganda effective<br />
August 22, 2016 while reviewing the country’s<br />
portfolio in consultation with the Government<br />
of Uganda. The Bank continues to work<br />
actively with the Ugandan authorities to<br />
address the outstanding performance issues<br />
in the portfolio including delays in project<br />
effectiveness.<br />
The Bank is committed to support the<br />
country’s development. Over the medium<br />
term, new IDA resources are targeted for use<br />
in Uganda, and these will be deployed in key<br />
areas outlined in the World Bank’s Country<br />
Partnership Framework (CPF) endorsed by the<br />
Bank’s Board on April 21, 2016. New<br />
operations could include significant support<br />
to areas such as improving intergovernmental<br />
fiscal transfers through the use of the<br />
Program for Results instrument.<br />
A planned Development Policy Operation<br />
(DPO) is currently on hold.<br />
Board<br />
presentation<br />
date to be<br />
determined<br />
6 INTERNATIONAL MONETARY FUND
<strong>UGANDA</strong><br />
Programmatic technical assistance on<br />
domestic revenue mobilization is in an early<br />
stage of its implementation.<br />
Ongoing<br />
Through<br />
December 2018<br />
Fund Work<br />
Program<br />
Economic update series (two per year) Ongoing Next update<br />
expected in<br />
Winter 2016/17.<br />
Seventh review of the PSI October 2016 December 2016<br />
2017 Staff Visit February 2017 February 2017<br />
Eight review of the PSI April 2017 June 2017<br />
TA priorities:<br />
Statistics<br />
<br />
E-GDDS<br />
July 2016<br />
August 2016<br />
<br />
National Accounts Workshop<br />
October 2016<br />
November 2016<br />
<br />
National Accounts<br />
October 2016<br />
November 2016<br />
<br />
Government Finance Statistics<br />
November 2016<br />
December 2016<br />
<br />
EAC GFS Workshop<br />
November 2016<br />
December 2016<br />
<br />
National Accounts<br />
January 2017<br />
February 2017<br />
<br />
National Accounts Workshop<br />
February 2017<br />
March 2017<br />
<br />
Monetary and Financial Statistics<br />
March 2017<br />
April 2017<br />
<br />
Government Finance Statistics<br />
April 2017<br />
May 2017<br />
<br />
National Accounts<br />
April 2017<br />
May 2017<br />
Fiscal issues<br />
<br />
Program-Based Budgeting (PBB)<br />
November 2016<br />
December 2016<br />
<br />
Expenditure arrears<br />
January 2017<br />
February 2017<br />
<br />
Cash Management and TSA<br />
January 2017<br />
February 2017<br />
<br />
Revenue Forecasting<br />
January 2017<br />
February 2017<br />
INTERNATIONAL MONETARY FUND 7
<strong>UGANDA</strong><br />
<br />
Tax policy stocktaking mission<br />
February 2017<br />
March 2017<br />
<br />
Public Investment Management<br />
Assessment (PIMA)<br />
March 2017<br />
April 2017<br />
<br />
Revenue administration ((TADAT followup;<br />
customs administration)<br />
TBD, FY2017/18<br />
<br />
Fiscal Transparency Evaluation Follow-up<br />
TBD, FY2017/18<br />
<br />
Natural resource revenue management<br />
TBD, FY2017/18<br />
Monetary and Financial Sectors<br />
<br />
Lender of Last Resort<br />
July 2016<br />
August 2016<br />
<br />
Towards Risk-Based Supervision of<br />
Insurance in Uganda<br />
September 2016<br />
October 2016<br />
<br />
Stock Taking Visit<br />
November 2016<br />
December 2016<br />
<br />
Assessment of FMIs<br />
November 2016<br />
December 2016<br />
<br />
Developing Supervisory Procedures for<br />
Agent Banking<br />
February 2017<br />
March 2017<br />
<br />
Insurance Supervision: Regional<br />
Workshop on RBS and RBS Solvency<br />
Requirements<br />
February 2017<br />
March 2017<br />
Joint Work<br />
Program<br />
Joint DSA update<br />
October/<br />
November 2016<br />
December 2016<br />
8 INTERNATIONAL MONETARY FUND
<strong>UGANDA</strong><br />
STATISTICAL ISSUES<br />
(as of November 2, 2016)<br />
I. Assessment of Data Adequacy for Surveillance<br />
General: Overall data provision is adequate for surveillance purposes, although some shortcomings remain.<br />
In July 2016 an e-GDDS implementation assisted the authorities in developing a National Summary Data<br />
Page (NSDP) using the Open Data Platform (ODP) to enable public dissemination of the<br />
e-GDDS data according to an advance release calendar. The authorities have issued a press release<br />
announcing that the NSDP will be launched by end-November.<br />
Real Sector Statistics: Since 2004 Uganda has been receiving technical assistance (TA) from the East<br />
African Technical Assistance Center (East AFRITAC) on the compilation of annual and quarterly national<br />
accounts and price statistics. With assistance from East AFRITAC and an external consultant, the Uganda<br />
Bureau of Statistics (UBOS) developed supply and use tables (SUT) that include preliminary product<br />
balances for 155 activities by 161 products. The rebased GDP estimates (FY2009/10) were released in<br />
November 2014. In January 2016 a mission assisted with developing quarterly expenditure approach<br />
accounts in current and constant prices. In March 2016, an STA mission provided TA on developing financial<br />
accounts. by institutional sector and in October 2016 an East AFRITAC mission provided TA on compiling<br />
the SUT for 2015.Uganda participated in an STA workshop on residential property price indexes (RPPI) and<br />
other property price indexes and it has developed the region’s first RPPI. Labor market indicators such as<br />
employment and wages/earnings are infrequently compiled and disseminated. UBOS aims to compile and<br />
disseminate these data categories on an annual basis, but due to resource and data limitations, these data<br />
are compiled with a two-year lag. The consumer price index (CPI) series released in January 2010 was<br />
replaced in June 2014 by the new CPI series that uses the expenditure weights from the 2009/2010 Uganda<br />
National Household Survey. UBOS compiles and disseminates a Producer Price Index (PPI) for<br />
manufacturing (separately for imports and domestic output) and for hotels. A January 2016 mission assisted<br />
with developing export and import price indexes and improving the producer price index for hotels and<br />
restaurants.<br />
Government Finance Statistics (GFS):<br />
The Ministry of Finance, Planning and Economic Development (MoFPED) compiles and reports annual<br />
(GFSY) budgetary central and local government data and monthly (IFS) budgetary central government data<br />
on a cash basis following the Government Finance Statistics Manual 2014 (GFSM 2014). East AFRITAC is<br />
providing technical assistance to the national authorities to expand the coverage and improve the quality of<br />
these statistics. The national GFS Technical Working Group, comprising representatives from MOFPED,<br />
UBOS and the Bank of Uganda (BOU) are working on the implementation of GFSM 2014 to meet East<br />
African Monetary Union (EAMU) Protocol’s fiscal statistics requirements. With the support of East AFRITAC,<br />
the authorities have recently achieved substantial progress in the area of GFS. They have expanded the<br />
coverage to the general government sector and have compiled, but not disseminated, general government<br />
GFS for financial years (FYs) 2013/14 and 2014/15. In addition, according to current plans, Uganda will<br />
disseminate estimates of the stock of financial assets and liabilities by 2017 and will complete<br />
implementation of GFSM 2014 by the end of 2017.<br />
INTERNATIONAL MONETARY FUND 9
<strong>UGANDA</strong><br />
Monetary and Financial Statistics: TA in FY2015/16 aims at improving the institutional coverage and<br />
classification of other depository corporations (ODCs) and initiating the collection and compilation of data<br />
for other financial corporations, including insurance companies, pension funds, non-deposit taking<br />
microfinance institutions, and foreign exchange bureaus. This would build on previous missions financed by<br />
DFID on the standardized report forms (SRFs). Uganda began publishing SRF-based monetary data from<br />
2002 in IFS beginning in early 2009. In addition, the TA also aimed at developing a system that would allow<br />
the BOU to collect information on financial positions with non-residents in the other East African<br />
Community (EAC) partner states, for the purpose of compiling union-wide MFS for the EAC.<br />
Financial sector surveillance: The BOU reports all 12 core financial soundness indicators (FSIs) and 7 of the<br />
13 encouraged FSIs for deposit takers, an FSI for households, and 2 FSIs for real estate markets. All FSIs are<br />
reported on a quarterly basis, except sectoral distribution of loans to total loans reported on a monthly<br />
basis, for posting on the IMF’s FSI website.<br />
External Sector Statistics (ESS): The BOU compiles quarterly balance of payments and international<br />
investment position (IIP) statistics on the basis of BPM6. The oldest time series of BPM6-based quarterly<br />
balance of payments and IIP are Q1-2001 and Q1-1999, respectively. Adjusting the coverage and valuation<br />
of trade in goods and services could improve the current account deficit. Separating balance of payment<br />
transactions from other flows, such as revaluation and other volume changes, may improve measurement<br />
of IIP financial stocks.<br />
Uganda is participating in the IMF–DFID Enhanced<br />
Data Dissemination Initiative, Quarterly National<br />
Accounts (QNA) Statistics Module. An initial<br />
mission was undertaken during November 2010 to<br />
review the data sources and compilation<br />
methodology used to compile QNA estimates and<br />
to make recommendations for improvements.<br />
Follow-up missions were undertaken during May<br />
and November 2011, May and November 2012,<br />
and May and November 2013. CPI, PPI and annual<br />
estimates of rebased GDP have been released.<br />
Major improvements have been made to the<br />
associated data sources, especially benchmark<br />
surveys and the compilation methodologies.<br />
Comprehensive supply and use tables (SUTs) have<br />
been compiled; and quarterly GDP by production<br />
approach (GDP-P) at constant and current prices<br />
disseminated. The quality and timeliness of the ESS<br />
has been improved and the estimates are<br />
consistent with the BPM6 standards.<br />
III.<br />
II.<br />
Data Standards and Quality<br />
Uganda has been a GDDS participant since May<br />
2000. In February 2005, a STA mission prepared a<br />
Report on the Observance of Standards and Codes<br />
(ROSC), with results published in July 2006. The ROSC<br />
mission assessed data compilation and dissemination<br />
practices against international standards in national<br />
accounts, prices, government finance, and balance of<br />
payments statistics. The monetary and financial<br />
statistics were not assessed.<br />
Reporting to STA<br />
Uganda reports government finance statistics (GFS) data according to the GFSM 2014 framework for the<br />
GFS Yearbook, but does not report any high frequency data for inclusion in the International Financial<br />
Statistics (IFS). The BoU regularly reports monetary data for the central bank and ODCs in the SRF format,<br />
and it also reports all core FSIs and some FSIs for deposit takers, households, and real estate markets.<br />
10 INTERNATIONAL MONETARY FUND
<strong>UGANDA</strong><br />
December 16, 2016<br />
SEVENTH REVIEW UNDER THE POLICY SUPPORT<br />
INSTRUMENT—DEBT SUSTAINABILITY ANALYSIS<br />
Approved By<br />
Roger Nord (IMF, AFR),<br />
Zuzana Murgasova (IMF, SPR),<br />
and Paloma Anos Casero<br />
(IDA)<br />
Prepared by the staff of the International Monetary<br />
Fund (IMF) and the International Development<br />
Association (IDA)<br />
Risk of external debt distress:<br />
Augmented by significant risks stemming from<br />
domestic public and/or private external debt?<br />
Low<br />
No<br />
The Debt Sustainability Analysis (DSA) update indicates that Uganda remains at low risk of<br />
debt distress. 1 The Ugandan authorities are in a phase of scaling up public investment in<br />
infrastructure to support high and sustainable growth over the medium- and long-term.<br />
As a result, debt is projected to continue increasing until these projects are completed and<br />
the expected growth dividend kicks in. Strong project selection and implementation<br />
frameworks will be key to the success of the authorities’ strategy, as well as fiscal<br />
consolidation once large infrastructure projects are completed, including by boosting<br />
domestic revenue mobilization. Weak exports, exposure to exchange rate depreciation, and<br />
low revenues as well as the short maturity of domestic debt pose risks to debt prospects.<br />
1<br />
The last Debt Sustainability Analysis (DSA) update was conducted in November 2015<br />
(IMF Country Report No. 15/321), while the last full DSA was conducted in June 2015<br />
(IMF Country Report No. 15/175). Under the Country Policy and Institutional Assessment (CPIA), Uganda is<br />
classified as a medium policy performer, with a CPIA score of 3.73 (3-year average, 2013–15). All data refer to<br />
fiscal years running from July to June (e.g., FY2016 covers July 2015 to June 2016, abbreviated as 2016 in the<br />
figures and tables). External debt is defined as foreign-currency denominated debt for purposes of the DSA.
<strong>UGANDA</strong><br />
BACKGOUND AND RECENT DEVELOPMENTS<br />
1. Uganda is in a phase of scaled up public investment to lay the foundation for future growth.<br />
The authorities seek to improve the quality of basic infrastructure (including roads and electricity<br />
transmissions), increase the capacity for electricity production through two major hydro-power projects<br />
(Karuma and Isimba), develop a new oil sector (8 production licenses were recently awarded, a pipeline to<br />
Tanga, Tanzania and a domestic refinery are in the planning phase), and build a standard gauge railway to<br />
the Kenyan border, ultimately connecting Kampala to Mombasa. Strong project selection and<br />
implementation frameworks that safeguard a high quality of spending will be key to realizing the envisaged<br />
growth dividend. Investment in human capital is needed in parallel.<br />
2. Uganda’s economic performance remains strong, but has moderated in recent years. The<br />
average growth rate declined from close to 8 percent in the five years to FY2011 to 4½ percent in the last<br />
five years. Similarly, the average current account deficit widened from 6 percent of GDP to 7¼ percent of<br />
GDP in the same period, reflecting slower growth in exports of goods and services which declined from an<br />
average of 20 percent to an average of 4 percent. At the same time, the pace of exchange rate depreciation<br />
picked up from 5¼ percent to 8½ percent on average per annum, resulting in lower nominal GDP growth<br />
in U.S. dollars (down from 12½ percent to 4½ percent average annual growth). Looking forward, growth is<br />
projected to recover to about 6 percent over the medium-term, in the context of a muted global recovery<br />
and spillovers from neighboring countries. Exports of goods and services have stagnated in recent years,<br />
owing to falling commodity prices and weak demand from trading partners, including adverse spillovers<br />
from the conflict in South Sudan.<br />
3. Government finances remain on a sound footing, though expenditure composition can be of<br />
concern. Notwithstanding some recent slippages, the authorities’ medium-term fiscal strategy remains<br />
prudent. Starting from a low base, revenue collection has been significantly strengthened over the last few<br />
years, and the authorities target an annual improvement of the tax revenue take by ½ percent of GDP. On<br />
the expenditure side, the authorities aim to reprioritize away from current to social and capital spending,<br />
although this has been challenging in recent years. The average maturity of domestic debt remains<br />
short—securities with maturities lower than one-year constitute close to 40 percent of the total as of<br />
mid-September 2016—reflecting structural market inefficiencies. Since debt relief was granted in 2006,<br />
Uganda has gradually accumulated external public debt to finance infrastructure projects mainly on energy<br />
and transportation (Chart 1). Public and publicly guaranteed (PPG) debt is mostly concessional multilateral<br />
debt, although the share of non-Paris Club creditors has increased to 19 percent of the total, reflecting<br />
higher borrowing from China (Chart 2). 2<br />
2<br />
Uganda owes a small amount in pre-HIPC Initiative arrears to non-Paris Club debtors, which continue to be deemed<br />
away under the revised arrears policy for official creditors, as the underlying Paris Club agreement was adequately<br />
representative and the authorities continue to make best efforts to resolve the arrears.<br />
2 INTERNATIONAL MONETARY FUND
<strong>UGANDA</strong><br />
Chart 1. Public Debt<br />
(Percent of GDP, fiscal year)<br />
Chart 2. Composition of PPG External Debt<br />
(Percent of total)<br />
80<br />
Domestic<br />
External<br />
80<br />
70<br />
70<br />
60<br />
60<br />
50<br />
50<br />
40<br />
40<br />
30<br />
30<br />
20<br />
20<br />
10<br />
10<br />
0<br />
0<br />
2004 2005 2006 2007 2008 2009 2010 2011 2012 2013 2014 2015 2016<br />
Sources: Ugandan authorities and IMF staff calculations.<br />
Changes in the Underlying Macroeconomic Assumptions<br />
4. The macroeconomic assumptions used in this DSA are aligned with the authorities’<br />
framework supported by the PSI. The baseline scenario assumes implementation of the authorities’<br />
economic policies and structural reforms. The main assumptions and changes compared to the previous<br />
DSA are (Text Table 1):<br />
<br />
<br />
<br />
<br />
Growth is projected at about 6½ percent on average over the medium term (1 percentage point lower<br />
than in the previous DSA), reflecting a weaker global environment, a lower execution rate for externally<br />
financed projects, and a one-year delay in the start of oil production compared to the previous DSA. Oil<br />
production is projected to raise real GDP growth by one percentage point on average during<br />
FY2023-FY2027 and would account for 5 percent of Uganda’s GDP during the peak extraction period<br />
(previously, 7 percent).<br />
The GDP deflator is projected at 5 percent over the medium term, somewhat higher than in the<br />
previous DSA, anchored by the 5 percent core inflation target and the terms of trade trend. Over the<br />
long term, it is expected to gradually converge again to around 4 percent.<br />
Oil revenue projections have been reduced somewhat, following a moderate downward revision in oil<br />
price assumptions in line with the latest WEO projections (from 63 to 58 dollars per barrel in FY2022<br />
when oil production is assumed to start). The projected start of production has been delayed,<br />
mainly due to prolonged negotiations over the routing of pipelines. Oil production licenses have<br />
now been awarded, and the final investment decisions are expected to be made in<br />
February 2018.<br />
The external current account deficit is estimated at 9 percent of GDP on average over the<br />
medium term (1 percent of GDP lower than in the last DSA), mostly financed with FDI and public<br />
sector borrowing. The lower deficit reflects the combined impact of updated assumptions on oil<br />
investment, the slower real effective exchange rate depreciation, and a revised profile of public<br />
investment, partly offset by weaker exports. Oil exports are projected to narrow the current<br />
account balance by 1 percent of GDP on average during the main production period (as in the<br />
previous DSA).<br />
INTERNATIONAL MONETARY FUND 3
<strong>UGANDA</strong><br />
Text Table 1. Selected Macroeconomic Indicators – Compared to the Previous DSA<br />
2017 2018-2022 2023-2027 2028-2032 2033-2037<br />
Average Average Average Average<br />
Real GDP growth (percent)<br />
Baseline 5.0 6.4 7.8 5.4 5.0<br />
excl. oil production 5.0 6.4 6.9 5.6 5.3<br />
Previous DSA 5.8 7.3 7.6 5.1 4.8<br />
Inflation (GDP deflator, national currency, percent)<br />
Baseline 5.1 5.1 4.1 4.0 3.9<br />
excl. oil production 5.1 5.0 3.9 4.0 4.0<br />
Previous DSA 4.0 4.5 4.1 3.9 3.9<br />
Nominal GDP (US$ billion)<br />
Baseline 26.5 33.4 59.6 99.2 145.0<br />
excl. oil production 26.5 33.4 57.2 93.5 138.9<br />
Previous DSA 26.1 35.7 64.5 104.2 150.8<br />
Current account balance (percent of GDP)<br />
Baseline -7.1 -8.7 -7.3 -5.5 -6.1<br />
excl. oil production -7.0 -7.5 -9.3 -8.2 -6.4<br />
Previous DSA -10.6 -10.1 -5.6 -4.8 -4.3<br />
Overall fiscal balance (percent of GDP)<br />
Baseline -6.0 -3.4 -2.0 -1.7 -1.5<br />
excl. oil production -6.0 -3.5 -3.0 -3.3 -2.9<br />
Previous DSA -6.6 -4.7 -1.6 -1.1 -1.3<br />
Public investment (percent of GDP)<br />
Baseline 11.0 9.2 9.0 9.0 8.7<br />
excl. oil production 11.0 9.1 8.3 8.1 7.9<br />
Previous DSA 11.5 10.6 9.4 9.3 8.9<br />
Oil-related revenue (percent of GDP)<br />
Baseline 0.0 0.2 1.9 2.7 2.4<br />
excl. oil production 0.0 0.0 0.0 0.0 0.0<br />
Previous DSA 0.0 0.8 2.8 3.3 2.5<br />
Source: IMF staff projections.<br />
<br />
<br />
The fiscal deficit is estimated to average 3¾ percent of GDP a year over the medium term—a decline of<br />
about one percentage point compared to the last DSA. In line with historical outturns, the deficit path<br />
assumes a project execution rate of 80 percent which implies a narrowing of about two-thirds of a<br />
percentage point in the overall fiscal deficit over the medium-run and subsequently a slower decline as<br />
projects take longer to complete. 3 In addition, over the long term, the deficit is marginally higher than in<br />
the last DSA to account for the lower oil prices.<br />
Nonconcessional borrowing is projected to remain unchanged at about US$8 billion over the<br />
medium term (cumulative from June 28, 2013), but annual disbursements before FY2025 are now<br />
anticipated to be lower, with the more realistic project execution rate for externally-financed<br />
development spending (Text Table 2). Debt contracted by end-December 2015 (US$3 billion)<br />
3<br />
In recent years, actual project execution rates have been about 80 percent for externally-financed development<br />
spending, while the execution rate for the two hydro power projects was much lower in the early days of construction.<br />
The execution rate for domestically financed public investment has been 100 percent.<br />
4 INTERNATIONAL MONETARY FUND
<strong>UGANDA</strong><br />
finances the construction of the Karuma and Isimba dams, industrial substations, the Entebbe<br />
Airport rehabilitation, and road construction projects. The DSA includes contingent liabilities<br />
stemming from public-private partnerships, including the construction of roads and the Hoima<br />
refinery.<br />
Text Table 2. Summary Table on External Borrowing Program<br />
PPG external debt contracted<br />
Volume of<br />
or guaranteed new debt 1<br />
Present value of<br />
new debt 1<br />
Year 1: FY2016/17<br />
Source of debt financing<br />
(Millions of U.S. dollars)<br />
1,299 957<br />
Concessional debt, of which 2 707 424<br />
Multilateral debt 595 357<br />
Bilateral debt 112 67<br />
Non-concessional debt, of which 2 592 533<br />
Semi-concessional debt 3 592 533<br />
Commercial-term debt 4 - -<br />
Use of debt financing 1,299 957<br />
Infrastructure 1,299 957<br />
Budget financing - -<br />
Memorandum items<br />
Indicative projections<br />
Year 2: FY2017/18 1,303 1,047<br />
Year 3: FY2018/19 - -<br />
Sources: Ugandan authorities and IMF staff projections.<br />
1 Contracting and guaranteeing of new debt. The present value of debt is calculated using the terms of individual loans<br />
and applying the 5 percent program discount rate.<br />
2 Debt with a grant element that exceeds a minimum threshold (35 percent).<br />
3 Debt with a positive grant element which does not meet the minimum threshold.<br />
4 Debt without a positive grant element. For commercial debt, the present value would be defined as the nominal/face<br />
value.<br />
EXTERNAL DEBT SUSTAINABILITY<br />
5. PPG external debt is assessed to be sustainable over the projection period. The PV of PPG<br />
external debt-to-GDP ratio is expected to peak at 22 percent in FY2021, which is lower than the projections<br />
in the previous DSA, reflecting the revised project execution rate. Nominal PPG external debt would stay<br />
below 31 percent of GDP in the projection period. All debt burden indicators are projected to remain below<br />
the debt burden thresholds for medium policy performers under the baseline scenario (Figure 1, Tables 1,<br />
and 3). Under the standardized stress tests, all but one debt service indicator are projected to remain below<br />
their respective thresholds.<br />
6. Only under the most extreme stress scenario, an exports shock, the PV of debt-to-exports<br />
ratio, shows a temporary breach of the threshold during FY2019–FY2021. The maximum breach is<br />
13 percentage points. This is related to the scaling-up of public investment, which leads to a temporary<br />
INTERNATIONAL MONETARY FUND 5
<strong>UGANDA</strong><br />
bump in several debt burden indicators. The severity of the export shock, driven by the large export growth<br />
volatility over the last ten years, might also overstate the vulnerabilities. In particular, the conflict in<br />
neighboring South Sudan has reduced the level of exports and contributed to the volatility of export<br />
growth. However, the vulnerability to export shocks is projected to be gradually reduced by the current<br />
scaling-up of infrastructure that should support Uganda’s exports. Indeed, over the long-term, all debt<br />
burden indicators are comfortably below the relevant thresholds. Staff, therefore, assesses that the external<br />
debt sustainability risk is low.<br />
7. Nevertheless, risks to debt sustainability have increased. The scaling-up of investment<br />
spending and related increases in semi-concessional borrowing lead to increased vulnerabilities. In turn,<br />
failure to realize the envisaged growth dividend from the increased investment is a key risk as the historical<br />
scenario illustrates. The muted export performance remains another important risk, with the large impact of<br />
the shock scenario relative to the baseline being due to the significant volatility in export growth, which<br />
exceeds the historical average growth rate of exports. This highlights the importance of enhancing the<br />
country’s competitiveness to boost exports over the medium term, including through effective public<br />
investment to fill infrastructure gaps. If growth and exports prospects were to be revised down in the future,<br />
this could adversely affect Uganda’s risk rating, as could additional reliance on non-concessional borrowing<br />
that would not lead to higher growth rates.<br />
8. Risks stemming from the uncertainty about oil production remain limited (customized<br />
scenario). In the baseline, it is assumed that the government uses half of its oil revenue to finance<br />
additional public investment—conceptually considering part of public investment directly tied to the<br />
existence of oil revenue. In the no-oil scenario, public investment is thus reduced by the amount tied to half<br />
of the “lost” oil revenue. However, the the fiscal deficit is still higher than in the baseline. As a result, the debt<br />
burden and debt service indicators over the long-term are somewhat higher than in the baseline scenario.<br />
Nevertheless, all external debt indicators remain below their respective thresholds with large margins,<br />
indicating a limited increase in debt sustainability risks. Moreover, as oil production licenses have now been<br />
awarded and the pipeline route agreed on, the uncertainty about oil production has declined. Nonetheless,<br />
given the high uncertainty of oil prices, keeping a prudent fiscal plan that does not overly rely on oil<br />
proceeds is warranted.<br />
PUBLIC DEBT SUSTAINABILITY<br />
9. Total public debt (external and domestic) is also assessed to be sustainable over the<br />
projection period. The PV of public debt-to-GDP ratio is projected to peak at about 36 percent in FY2021,<br />
well below the benchmark level of 56 percent associated with heightened public debt vulnerabilities for<br />
medium performers (Figure 2, Tables 2 and 4). However, the relatively short average maturity of domestic<br />
debt combined with a low revenue base continues to be a matter of concern. The debt service-to-revenue<br />
ratio (including grants) is projected to stay close to 40 percent until FY2022, among the highest in lowincome<br />
countries, indicating high rollover and interest rate risks. These risks need to be mitigated by a<br />
combination of stronger revenue mobilization and determined efforts to extend average maturities over the<br />
medium term. In the latest Medium Term Debt Strategy released in June 2016, the authorities commit to<br />
keeping the average maturity of domestic debt above three years and reduce the ratio of short term bills to<br />
6 INTERNATIONAL MONETARY FUND
<strong>UGANDA</strong><br />
longer term bonds to 30:70. Overall, the authorities’ capacity regarding debt management, monitoring and<br />
reporting is improving, aided by IMF and World Bank technical assistance.<br />
10. Deviations from fiscal objectives are the main risks to debt sustainability. An illustrative<br />
scenario with a fixed primary deficit over the projection period indicates a significantly higher PV of public<br />
debt-to-GDP ratio, exceeding the benchmark level of 56 percent of GDP in the long run. This highlights the<br />
importance of staying the course on fiscal policies (revenue mobilization, expenditure reprioritization) and<br />
reducing fiscal deficits immediately after the planned scaling up of public investment has been completed.<br />
The customized alternative scenario without oil flows indicates elevated but limited risks stemming from<br />
uncertainty about oil revenues, as in the case for the external debt analysis.<br />
CONCLUSION<br />
11. Uganda’s risk of external debt distress remains low. Uganda’s debt levels remain low, and the<br />
temporary increase in borrowing is intended to finance growth-enhancing scaled-up public investment.<br />
However, risks to debt sustainability have increased, as the temporary breach under an export shock<br />
scenario illustrates. To mitigate these risks, it is important to ensure sound project selection and<br />
implementation, a reprioritization of expenditures, and domestic revenue mobilization. Strong governance<br />
frameworks are equally essential to safeguard the quality and effectiveness of public investment (and<br />
spending in general). A better infrastructure and the impact of parallel reforms, e.g., improvements in the<br />
business climate, are expected to strengthen Uganda’s competitiveness. The real effective exchange rate<br />
depreciation over the past year should also help boost stagnating exports over the medium term. Sound<br />
asset-liability management and avoiding a premature reliance on uncertain future oil flows remain essential<br />
preconditions for debt sustainability.<br />
12. The authorities concurred with staff’s views. They remain committed to ensuring debt<br />
sustainability through long-term prudent debt management, as outlined in their Medium Term Debt<br />
Management Framework, which aims at minimizing costs and risks associated with public investment<br />
project financing. The authorities acknowledged the risks, in particular from weak exports, and intend to<br />
closely monitor developments, and stand ready to adjust policies as needed to safeguard debt<br />
sustainability. They also comit to continue to engage with IDA/IMF staff on debt management issues and to<br />
address the short maturity of domestic debt by building policy credibility and deepening the markets.<br />
INTERNATIONAL MONETARY FUND 7
<strong>UGANDA</strong><br />
Figure 1. Uganda: Indicators of Public and Publicly Guaranteed External Debt<br />
under Alternatives Scenarios, 2017-2037 1/<br />
5<br />
4<br />
3<br />
2<br />
1<br />
a. Debt Accumulation<br />
0<br />
0<br />
2017 2022 2027 2032 2037<br />
180<br />
160<br />
140<br />
120<br />
100<br />
80<br />
60<br />
40<br />
20<br />
Rate of Debt Accumulation<br />
Grant-equivalent financing (% of GDP)<br />
Grant element of new borrowing (% right scale)<br />
c.PV of debt-to-exports ratio<br />
0<br />
2017 2022 2027 2032 2037<br />
60<br />
50<br />
40<br />
30<br />
20<br />
10<br />
b.PV of debt-to GDP ratio<br />
45<br />
40<br />
35<br />
30<br />
25<br />
20<br />
15<br />
10<br />
5<br />
0<br />
2017 2022 2027 2032 2037<br />
d.PV of debt-to-revenue ratio<br />
300<br />
250<br />
200<br />
150<br />
100<br />
50<br />
0<br />
2017 2022 2027 2032 2037<br />
25<br />
e.Debt service-to-exports ratio<br />
25<br />
f.Debt service-to-revenue ratio<br />
20<br />
20<br />
15<br />
15<br />
10<br />
10<br />
5<br />
5<br />
0<br />
2017 2022 2027 2032 2037<br />
0<br />
2017 2022 2027 2032 2037<br />
Baseline Historical scenario Most extreme shock 1/<br />
Threshold<br />
No oil scenario<br />
Sources: Country authorities; and staff estimates and projections.<br />
1/ The most extreme stress test is the test that yields the highest ratio on or before 2027. In figure b. it corresponds to a<br />
One-time depreciation shock; in c. to a Exports shock; in d. to a One-time depreciation shock; in e. to a Exports shock<br />
and in figure f. to a One-time depreciation shock<br />
8 INTERNATIONAL MONETARY FUND
<strong>UGANDA</strong><br />
Figure 2. Uganda: Indicators of Public Debt Under Alternative Scenarios, 2017–2037 1/<br />
Baseline<br />
Historical scenario<br />
Fix Primary Balance<br />
Public debt benchmark<br />
Most extreme shock 1/<br />
No oil scenario<br />
80<br />
70<br />
PV of Debt-to-GDP Ratio<br />
60<br />
50<br />
40<br />
30<br />
20<br />
10<br />
0<br />
400<br />
350<br />
2017 2019 2021 2023 2025 2027 2029 2031 2033 2035 2037<br />
PV of Debt-to-Revenue Ratio 2/<br />
300<br />
250<br />
200<br />
150<br />
100<br />
50<br />
0<br />
2017 2019 2021 2023 2025 2027 2029 2031 2033 2035 2037<br />
50<br />
45<br />
Debt Service-to-Revenue Ratio 2/<br />
40<br />
35<br />
30<br />
25<br />
20<br />
15<br />
10<br />
5<br />
0<br />
2017 2019 2021 2023 2025 2027 2029 2031 2033 2035 2037<br />
Sources: Country authorities; and staff estimates and projections.<br />
1/ The most extreme stress test is the test that yields the highest ratio on or before 2027.<br />
2/ Revenues are defined inclusive of grants.<br />
INTERNATIONAL MONETARY FUND 9
10 INTERNATIONAL MONETARY FUND<br />
Table 1. Uganda: External Debt Sustainability Framework, Baseline Scenario, 2014–2037 1 /<br />
(Percent of GDP, unless otherwise indicated)<br />
6/<br />
Actual<br />
Historical Standard 6/<br />
Projections<br />
Average Deviation 2017-2022 2023-2037<br />
2014 2015 2016 2017 2018 2019 2020 2021 2022 Average 2027 2037 Average<br />
External debt (nominal) 1/ 29.9 34.8 39.0 41.5 43.7 44.3 45.5 47.8 44.2 35.0 36.5<br />
of which: public and publicly guaranteed (PPG) 15.8 18.5 20.9 25.0 28.1 29.1 29.9 30.5 28.3 23.2 19.4<br />
Change in external debt 0.7 4.8 4.3 2.4 2.3 0.6 1.2 2.3 -3.6 -0.9 1.1<br />
Identified net debt-creating flows 1.7 5.5 8.4 3.6 2.2 1.7 1.6 1.3 0.0 0.0 1.9<br />
Non-interest current account deficit 6.2 6.1 4.7 5.2 2.2 5.7 6.6 6.9 6.7 6.5 6.7 4.7 4.5 4.6<br />
Deficit in balance of goods and services 9.7 10.7 10.4 10.5 10.5 10.7 10.0 10.1 9.3 4.7 6.0<br />
Exports 18.2 18.1 18.2 19.0 19.5 20.5 21.2 21.9 23.0 26.2 24.3<br />
Imports 27.9 28.8 28.6 29.5 30.0 31.2 31.2 32.0 32.4 30.9 30.3<br />
Net current transfers (negative = inflow) -4.3 -5.1 -6.3 -6.5 1.4 -5.1 -4.5 -4.7 -4.3 -4.4 -3.9 -3.1 -3.0 -3.1<br />
of which: official -0.7 -0.9 -1.0 -1.4 -0.9 -0.7 -0.2 -0.4 -0.3 -0.2 0.0<br />
Other current account flows (negative = net inflow) 0.8 0.6 0.5 0.4 0.6 0.9 0.9 0.7 1.3 3.1 1.4<br />
Net FDI (negative = inflow) -2.9 -1.9 -1.7 -3.0 1.1 -1.7 -3.8 -4.7 -4.8 -4.8 -5.7 -4.3 -3.1 -4.2<br />
Endogenous debt dynamics 2/ -1.5 1.3 5.4 -0.4 -0.5 -0.5 -0.4 -0.4 -1.0 -0.5 0.6<br />
Contribution from nominal interest rate 1.4 1.1 1.3 1.4 1.6 2.0 2.2 2.4 2.2 1.6 2.1<br />
Contribution from real GDP growth -1.4 -1.6 -1.9 -1.8 -2.1 -2.4 -2.5 -2.8 -3.2 -2.0 -1.6<br />
Contribution from price and exchange rate changes -1.6 1.8 5.9 … … … … … … … …<br />
Residual (3-4) 3/ -1.0 -0.7 -4.1 -1.1 0.0 -1.1 -0.4 1.0 -3.6 -0.8 -0.8<br />
of which: exceptional financing 0.0 0.0 0.0 0.0 0.0 0.0 0.0 0.0 0.0 0.0 0.0<br />
PV of external debt 4/ ... ... 30.7 32.7 34.8 35.6 37.0 39.4 36.6 29.8 32.8<br />
In percent of exports ... ... 168.0 172.1 178.6 173.5 174.8 179.9 158.9 113.7 134.8<br />
PV of PPG external debt ... ... 12.5 16.2 19.2 20.4 21.3 22.0 20.7 18.0 15.7<br />
In percent of exports ... ... 68.5 85.3 98.4 99.3 100.8 100.7 90.0 68.6 64.7<br />
In percent of government revenues ... ... 92.3 115.4 131.7 136.3 138.0 138.1 125.4 96.9 77.7<br />
Debt service-to-exports ratio (in percent) 11.7 9.6 15.3 15.7 15.0 18.3 15.8 15.7 13.3 10.7 14.8<br />
PPG debt service-to-exports ratio (in percent) 2.6 2.7 3.4 3.6 6.2 6.4 5.0 5.4 4.4 5.7 6.4<br />
PPG debt service-to-revenue ratio (in percent) 4.1 3.7 4.6 4.9 8.3 8.8 6.8 7.4 6.1 8.1 7.7<br />
Total gross financing need (Billions of U.S. dollars) 1.8 2.0 1.9 2.3 2.1 2.3 2.3 2.4 2.2 4.3 13.5<br />
Non-interest current account deficit that stabilizes debt ratio 5.5 1.3 0.4 3.3 4.3 6.3 5.5 4.2 10.4 5.6 3.4<br />
Key macroeconomic assumptions<br />
Real GDP growth (in percent) 5.2 5.1 4.8 6.2 2.2 5.0 5.5 6.0 6.3 6.5 7.7 6.2 6.3 4.8 6.0<br />
GDP deflator in US dollar terms (change in percent) 5.6 -5.7 -14.6 2.1 8.9 2.4 1.0 0.8 3.6 -0.1 5.5 2.2 4.6 3.7 4.2<br />
Effective interest rate (percent) 5/ 5.4 3.5 3.4 6.3 2.7 3.8 4.1 4.8 5.4 5.5 5.2 4.8 4.9 6.5 5.3<br />
Growth of exports of G&S (US dollar terms, in percent) -0.1 -1.2 -9.8 11.8 13.9 11.9 9.3 12.4 13.7 10.0 19.6 12.8 14.2 7.5 10.9<br />
Growth of imports of G&S (US dollar terms, in percent) 2.2 2.3 -10.8 11.1 14.5 10.5 8.6 11.2 10.0 9.1 15.0 10.7 8.5 8.6 10.0<br />
Grant element of new public sector borrowing (in percent) ... ... ... ... ... 21.8 16.0 21.5 22.2 23.5 21.4 21.1 17.2 13.2 16.2<br />
Government revenues (excluding grants, in percent of GDP) 11.6 13.0 13.5 14.0 14.6 14.9 15.5 16.0 16.5 18.5 20.3 19.3<br />
Aid flows (in Billions of US dollars) 7/ 0.5 0.7 0.4 1.1 0.7 0.9 0.7 0.6 0.6 0.8 0.9<br />
of which: Grants 0.3 0.3 0.3 0.5 0.4 0.4 0.2 0.2 0.1 0.2 0.0<br />
of which: Concessional loans 0.2 0.4 0.1 0.6 0.4 0.5 0.4 0.4 0.4 0.6 0.9<br />
Grant-equivalent financing (in percent of GDP) 8/ ... ... ... 3.1 2.1 2.1 1.4 1.2 0.9 0.7 0.3 0.5<br />
Grant-equivalent financing (in percent of external financing) 8/ ... ... ... 41.0 35.0 37.9 35.7 37.4 30.2 24.3 13.2 19.9<br />
Memorandum items:<br />
Nominal GDP (Billions of US dollars) 27.8 27.5 24.7 26.5 28.2 30.2 33.2 35.3 40.1 74.0 178.3<br />
Nominal dollar GDP growth 11.1 -0.8 -10.4 7.5 6.5 6.8 10.1 6.4 13.6 8.5 11.3 8.7 10.5<br />
PV of PPG external debt (in Billions of US dollars) 3.1 4.3 5.2 6.2 7.0 7.6 8.4 13.3 28.0<br />
(PVt-PVt-1)/GDPt-1 (in percent) 4.7 3.6 3.2 2.7 1.9 2.1 3.1 1.7 1.2 1.5<br />
Gross workers' remittances (Billions of US dollars) 1.0 1.2 1.3 1.0 1.0 1.2 1.3 1.4 1.6 2.8 6.1<br />
PV of PPG external debt (in percent of GDP + remittances) ... ... 11.9 15.6 18.5 19.6 20.5 21.2 19.9 17.3 15.2<br />
PV of PPG external debt (in percent of exports + remittances) ... ... 53.1 71.3 82.9 83.1 84.7 85.1 76.8 60.0 56.7<br />
Debt service of PPG external debt (in percent of exports + remittances) ... ... 2.7 3.0 5.2 5.4 4.2 4.5 3.7 5.0 5.6<br />
Sources: Country authorities; and staff estimates and projections.<br />
1/ Includes both public and private sector external debt.<br />
2/ Derived as [r - g - ρ(1+g)]/(1+g+ρ+gρ) times previous period debt ratio, with r = nominal interest rate; g = real GDP growth rate, and ρ = growth rate of GDP deflator in U.S. dollar terms.<br />
3/ Includes exceptional financing (i.e., changes in arrears and debt relief); changes in gross foreign assets; and valuation adjustments. For projections also includes contribution from price and exchange rate changes.<br />
4/ Assumes that PV of private sector debt is equivalent to its face value.<br />
5/ Current-year interest payments divided by previous period debt stock.<br />
6/ Historical averages and standard deviations are generally derived over the past 10 years, subject to data availability.<br />
7/ Defined as grants, concessional loans, and debt relief.<br />
8/ Grant-equivalent financing includes grants provided directly to the government and through new borrowing (difference between the face value and the PV of new debt).<br />
<strong>UGANDA</strong>
Table 2. Uganda: Public Sector Debt Sustainability Framework, Baseline Scenario, 2014–2037<br />
(Percent of GDP, unless otherwise indicated)<br />
Actual<br />
2014 2015 2016<br />
Average<br />
5/ Standard<br />
Deviation<br />
5/<br />
Estimate<br />
Projections<br />
2017-22<br />
2017 2018 2019 2020 2021 2022 Average 2027 2037<br />
2023-37<br />
Average<br />
Public sector debt 1/ 28.3 31.8 34.5 38.6 41.5 42.2 43.4 44.3 42.8 35.7 31.2<br />
of which: foreign-currency denominated 15.8 18.5 20.9 25.0 28.1 29.1 29.9 30.5 28.3 23.2 19.4<br />
Change in public sector debt 2.2 3.5 2.8 4.1 2.8 0.7 1.1 0.9 -1.4 -0.8 -0.2<br />
Identified debt-creating flows 1.9 5.8 2.6 3.6 2.8 0.8 1.1 0.9 -2.2 -1.5 -1.0<br />
Primary deficit 2.6 2.7 2.8 2.0 1.0 3.8 2.5 1.6 0.6 0.5 0.3 1.5 0.2 -0.2 -0.2<br />
Revenue and grants 12.6 14.2 14.9 15.9 15.9 16.1 16.2 16.5 16.9 18.8 20.3<br />
of which: grants 1.0 1.2 1.4 1.8 1.4 1.2 0.7 0.6 0.3 0.2 0.0<br />
Primary (noninterest) expenditure 15.2 16.9 17.7 19.6 18.4 17.7 16.8 17.0 17.1 19.0 20.1<br />
Automatic debt dynamics -0.7 2.7 -0.1 -0.2 0.3 -1.6 -1.2 -0.6 -3.8 -1.7 -0.8<br />
Contribution from interest rate/growth differential -0.5 -0.6 -0.2 -0.4 -0.7 -1.1 -1.3 -1.4 -2.1 -1.1 -0.5<br />
of which: contribution from average real interest rate 0.8 0.7 1.3 1.3 1.3 1.2 1.2 1.2 1.0 1.0 0.9<br />
of which: contribution from real GDP growth -1.3 -1.4 -1.5 -1.6 -2.0 -2.3 -2.5 -2.6 -3.2 -2.2 -1.4<br />
Contribution from real exchange rate depreciation -0.2 3.4 0.1 0.1 1.0 -0.5 0.1 0.9 -1.6 ... ...<br />
Other identified debt-creating flows 0.0 0.3 0.0 0.1 0.1 0.8 1.7 1.0 1.3 0.0 0.0<br />
Privatization receipts (negative) 0.0 0.0 0.0 0.0 0.0 0.0 0.0 0.0 0.0 0.0 0.0<br />
Recognition of implicit or contingent liabilities 0.0 0.0 0.0 0.0 0.0 0.8 1.7 1.0 1.3 0.0 0.0<br />
Debt relief (HIPC and other) 0.0 0.0 0.0 0.0 0.0 0.0 0.0 0.0 0.0 0.0 0.0<br />
Other (specify, e.g. bank recapitalization) 0.0 0.3 0.0 0.1 0.1 0.0 0.0 0.0 0.0 0.0 0.0<br />
Residual, including asset changes 0.3 -2.3 0.1 0.5 0.0 0.0 0.0 0.0 0.8 0.7 0.8<br />
Other Sustainability Indicators<br />
PV of public sector debt ... ... 26.2 29.9 32.6 33.5 34.8 35.8 35.3 30.4 27.6<br />
of which: foreign-currency denominated ... ... 12.5 16.2 19.2 20.4 21.3 22.0 20.7 18.0 15.7<br />
of which: external ... ... 12.5 16.2 19.2 20.4 21.3 22.0 20.7 18.0 15.7<br />
PV of contingent liabilities (not included in public sector debt) ... ... ... ... ... ... ... ... ... ... ...<br />
Gross financing need 2/ 11.0 12.0 13.0 14.2 13.4 12.3 10.8 11.0 10.8 9.9 8.9<br />
PV of public sector debt-to-revenue and grants ratio (in percent) … … 175.7 188.3 204.7 208.0 215.5 216.5 209.0 161.9 136.1<br />
PV of public sector debt-to-revenue ratio (in percent) … … 193.3 212.9 223.8 224.4 225.3 224.4 213.3 164.1 136.1<br />
of which: external 3/ … … 92.3 115.4 131.7 136.3 138.0 138.1 125.4 96.9 77.7<br />
Debt service-to-revenue and grants ratio (in percent) 4/ 34.9 33.6 36.0 35.6 38.6 37.8 35.7 36.0 36.2 30.7 27.9<br />
Debt service-to-revenue ratio (in percent) 4/ 37.9 36.7 39.6 40.2 42.2 40.8 37.3 37.3 37.0 31.1 27.9<br />
Primary deficit that stabilizes the debt-to-GDP ratio 0.4 -0.7 0.0 -0.3 -0.4 0.8 -0.5 -0.4 1.7 1.0 0.1<br />
INTERNATIONAL MONETARY FUND 11<br />
Key macroeconomic and fiscal assumptions<br />
Real GDP growth (in percent) 5.2 5.1 4.8 6.2 2.2 5.0 5.5 6.0 6.3 6.5 7.7 6.2 6.3 4.8 6.0<br />
Average nominal interest rate on forex debt (in percent) 1.2 1.0 1.4 1.2 0.3 1.5 1.9 2.3 2.5 2.5 2.6 2.2 2.9 3.5 3.1<br />
Average real interest rate on domestic debt (in percent) 8.4 6.8 9.8 3.9 6.0 9.9 10.5 9.8 8.9 8.7 7.0 9.1 7.1 6.0 7.1<br />
Real exchange rate depreciation (in percent, + indicates depreciation) -1.4 22.6 0.3 0.4 13.2 0.7 ... ... ... ... ... ... ... ... ...<br />
Inflation rate (GDP deflator, in percent) 3.4 5.1 4.0 8.6 5.7 5.1 4.7 4.8 4.8 3.8 7.4 5.1 4.5 3.9 4.0<br />
Growth of real primary spending (deflated by GDP deflator, in percent) 7.5 17.1 9.7 3.5 6.0 16.3 -1.3 2.0 0.8 8.0 8.5 5.7 9.5 5.0 7.2<br />
Grant element of new external borrowing (in percent) ... ... ... … … 21.8 16.0 21.5 22.2 23.5 21.4 21.1 17.2 13.2 ...<br />
Sources: Country authorities; and staff estimates and projections.<br />
1/ The public sector sector includes the central government only and gross debt is used for all presentations. For purposes of the DSA, public domestic debt includes contingent liabilities stemming from public-private partnerships.<br />
2/ Gross financing need is defined as the primary deficit plus debt service plus the stock of short-term debt at the end of the last period.<br />
3/ Revenues excluding grants.<br />
4/ Debt service is defined as the sum of interest and amortization of medium and long-term debt.<br />
5/ Historical averages and standard deviations are generally derived over the past 10 years, subject to data availability.<br />
<strong>UGANDA</strong>
<strong>UGANDA</strong><br />
Table 3. Uganda: Sensitivity Analysis for Key Indicators of Public and Publicly Guaranteed<br />
External Debt, 2017–2037<br />
(Percent)<br />
Projections<br />
2017 2018 2019 2020 2021 2022 2027 2037<br />
PV of debt-to GDP ratio<br />
Baseline 16 19 20 21 22 21 18 16<br />
A. Alternative Scenarios<br />
A1. Key variables at their historical averages in 2017-2037 1/ 16 18 19 21 22 22 31 32<br />
A2. New public sector loans on less favorable terms in 2017-2037 2 16 20 23 24 25 25 23 24<br />
A3. Alternative Scenario : No Oil Scenario 16 19 20 21 22 21 20 17<br />
B. Bound Tests<br />
B1. Real GDP growth at historical average minus one standard deviation in 2018-2019 16 19 21 22 22 21 19 16<br />
B2. Export value growth at historical average minus one standard deviation in 2018-2019 3/ 16 20 26 26 27 26 21 16<br />
B3. US dollar GDP deflator at historical average minus one standard deviation in 2018-2019 16 20 24 25 25 24 21 18<br />
B4. Net non-debt creating flows at historical average minus one standard deviation in 2018-2019 4/ 16 20 24 24 24 24 19 16<br />
B5. Combination of B1-B4 using one-half standard deviation shocks 16 20 27 27 28 27 22 18<br />
B6. One-time 30 percent nominal depreciation relative to the baseline in 2018 5/ 16 26 29 30 31 30 26 22<br />
PV of debt-to-exports ratio<br />
Baseline 85 98 99 101 101 90 69 65<br />
A. Alternative Scenarios<br />
A1. Key variables at their historical averages in 2017-2037 1/ 85 94 94 98 99 96 120 131<br />
A2. New public sector loans on less favorable terms in 2017-2037 2 85 101 110 113 114 107 89 98<br />
A3. Alternative Scenario : No Oil Scenario 85 95 99 99 99 97 90 76<br />
B. Bound Tests<br />
B1. Real GDP growth at historical average minus one standard deviation in 2018-2019 85 95 99 99 98 90 69 65<br />
B2. Export value growth at historical average minus one standard deviation in 2018-2019 3/ 85 117 163 160 157 142 101 86<br />
B3. US dollar GDP deflator at historical average minus one standard deviation in 2018-2019 85 95 99 99 98 90 69 65<br />
B4. Net non-debt creating flows at historical average minus one standard deviation in 2018-2019 4/ 85 101 115 114 112 102 74 66<br />
B5. Combination of B1-B4 using one-half standard deviation shocks 85 105 135 133 131 119 86 75<br />
B6. One-time 30 percent nominal depreciation relative to the baseline in 2018 5/ 85 95 99 99 98 90 69 65<br />
PV of debt-to-revenue ratio<br />
Baseline 115 132 136 138 138 125 97 78<br />
A. Alternative Scenarios<br />
A1. Key variables at their historical averages in 2017-2037 1/ 115 126 129 134 135 134 169 157<br />
A2. New public sector loans on less favorable terms in 2017-2037 2 115 135 151 154 156 149 126 118<br />
A3. Alternative Scenario : No Oil Scenario 115 127 136 136 135 128 106 85<br />
B. Bound Tests<br />
B1. Real GDP growth at historical average minus one standard deviation in 2018-2019 115 130 141 141 139 130 100 80<br />
B2. Export value growth at historical average minus one standard deviation in 2018-2019 3/ 115 140 174 171 168 155 111 81<br />
B3. US dollar GDP deflator at historical average minus one standard deviation in 2018-2019 115 138 160 159 158 147 113 91<br />
B4. Net non-debt creating flows at historical average minus one standard deviation in 2018-2019 4/ 115 136 158 156 153 142 105 79<br />
B5. Combination of B1-B4 using one-half standard deviation shocks 115 140 180 176 174 161 117 87<br />
B6. One-time 30 percent nominal depreciation relative to the baseline in 2018 5/ 115 182 194 193 192 179 138 110<br />
12 INTERNATIONAL MONETARY FUND
<strong>UGANDA</strong><br />
Table 3. Uganda: Sensitivity Analysis for Key Indicators of Public and Publicly Guaranteed<br />
External Debt, 2017–2037 (concluded)<br />
(Percent)<br />
Projections<br />
2017 2018 2019 2020 2021 2022 2027 2037<br />
Debt service-to-exports ratio<br />
Baseline 4 6 6 5 5 4 6 6<br />
A. Alternative Scenarios<br />
A1. Key variables at their historical averages in 2017-2037 1/ 4 6 6 5 5 4 8 13<br />
A2. New public sector loans on less favorable terms in 2017-2037 2 4 6 6 5 5 4 6 9<br />
A3. Alternative Scenario : No Oil Scenario 4 6 6 5 5 5 7 7<br />
B. Bound Tests<br />
B1. Real GDP growth at historical average minus one standard deviation in 2018-2019 4 6 6 5 5 4 6 6<br />
B2. Export value growth at historical average minus one standard deviation in 2018-2019 3/ 4 7 9 8 8 7 9 9<br />
B3. US dollar GDP deflator at historical average minus one standard deviation in 2018-2019 4 6 6 5 5 4 6 6<br />
B4. Net non-debt creating flows at historical average minus one standard deviation in 2018-2019 4/ 4 6 7 6 6 5 6 7<br />
B5. Combination of B1-B4 using one-half standard deviation shocks 4 6 7 6 7 6 7 8<br />
B6. One-time 30 percent nominal depreciation relative to the baseline in 2018 5/ 4 6 6 5 5 4 6 6<br />
Debt service-to-revenue ratio<br />
Baseline 5 8 9 7 7 6 8 8<br />
A. Alternative Scenarios<br />
A1. Key variables at their historical averages in 2017-2037 1/ 5 8 8 7 7 6 12 15<br />
A2. New public sector loans on less favorable terms in 2017-2037 2 5 8 8 7 7 6 8 10<br />
A3. Alternative Scenario : No Oil Scenario 5 8 9 7 7 6 9 8<br />
B. Bound Tests<br />
B1. Real GDP growth at historical average minus one standard deviation in 2018-2019 5 8 9 7 8 6 8 8<br />
B2. Export value growth at historical average minus one standard deviation in 2018-2019 3/ 5 8 9 8 9 7 10 8<br />
B3. US dollar GDP deflator at historical average minus one standard deviation in 2018-2019 5 9 10 8 9 7 9 9<br />
B4. Net non-debt creating flows at historical average minus one standard deviation in 2018-2019 4/ 5 8 9 8 8 7 9 8<br />
B5. Combination of B1-B4 using one-half standard deviation shocks 5 9 10 9 9 8 10 9<br />
B6. One-time 30 percent nominal depreciation relative to the baseline in 2018 5/ 5 12 13 10 10 9 11 11<br />
Memorandum item:<br />
Grant element assumed on residual financing (i.e., financing required above baseline) 6/ 13 13 13 13 13 13 13 13<br />
Sources: Country authorities; and staff estimates and projections.<br />
1/ Variables include real GDP growth, growth of GDP deflator (in U.S. dollar terms), non-interest current account in percent of GDP, and non-debt creating flows.<br />
2/ Assumes that the interest rate on new borrowing is by 2 percentage points higher than in the baseline., while grace and maturity periods are the same as in the baseline.<br />
3/ Exports values are assumed to remain permanently at the lower level, but the current account as a share of GDP is assumed to return to its baseline level after the shock<br />
(implicitly assuming an offsetting adjustment in import levels).<br />
4/ Includes official and private transfers and FDI.<br />
5/ Depreciation is defined as percentage decline in dollar/local currency rate, such that it never exceeds 100 percent.<br />
6/ Applies to all stress scenarios except for A2 (less favorable financing) in which the terms on all new financing are as specified in footnote 2.<br />
INTERNATIONAL MONETARY FUND 13
<strong>UGANDA</strong><br />
Table 4. Uganda: Sensitivity Analysis for Key Indicators of Public Debt 2017–2037<br />
(Percent)<br />
Projections<br />
2017 2018 2019 2020 2021 2022 2027 2037<br />
PV of Debt-to-GDP Ratio<br />
Baseline 30 33 34 35 36 35 30 28<br />
A. Alternative scenarios<br />
A1. Real GDP growth and primary balance are at historical averages 30 32 33 36 38 39 45 48<br />
A2. Primary balance is unchanged from 2017 30 34 36 40 44 46 53 69<br />
A3. Permanently lower GDP growth 1/ 30 33 34 36 37 37 35 43<br />
A4. Alternative Scenario : No Oil Scenario 30 33 33 35 35 35 33 32<br />
B. Bound tests<br />
B1. Real GDP growth is at historical average minus one standard deviations in 2018-2019 30 33 35 37 39 38 35 36<br />
B2. Primary balance is at historical average minus one standard deviations in 2018-2019 30 33 35 36 37 37 31 28<br />
B3. Combination of B1-B2 using one half standard deviation shocks 30 33 35 36 37 37 33 31<br />
B4. One-time 30 percent real depreciation in 2018 30 40 40 41 42 41 34 31<br />
B5. 10 percent of GDP increase in other debt-creating flows in 2018 30 41 42 43 44 42 35 30<br />
Baseline 188 205 208 215 217 209 162 136<br />
A. Alternative scenarios<br />
A1. Real GDP growth and primary balance are at historical averages 188 201 206 221 231 233 237 239<br />
A2. Primary balance is unchanged from 2017 188 212 226 250 267 271 281 343<br />
A3. Permanently lower GDP growth 1/ 188 206 211 221 224 219 187 214<br />
A4. Alternative Scenario : No Oil Scenario 188 204 208 214 214 219 206 201<br />
B. Bound tests<br />
PV of Debt-to-Revenue Ratio 2/<br />
B1. Real GDP growth is at historical average minus one standard deviations in 2018-2019 188 209 219 229 233 227 187 177<br />
B2. Primary balance is at historical average minus one standard deviations in 2018-2019 188 208 218 225 226 217 167 139<br />
B3. Combination of B1-B2 using one half standard deviation shocks 188 206 215 224 226 219 173 152<br />
B4. One-time 30 percent real depreciation in 2018 188 252 249 255 255 242 181 155<br />
B5. 10 percent of GDP increase in other debt-creating flows in 2018 188 259 258 264 264 251 187 150<br />
Debt Service-to-Revenue Ratio 2/<br />
Baseline 36 39 38 36 36 36 31 28<br />
A. Alternative scenarios<br />
A1. Real GDP growth and primary balance are at historical averages 36 38 37 35 36 37 36 34<br />
A2. Primary balance is unchanged from 2017 36 39 38 36 37 38 36 41<br />
A3. Permanently lower GDP growth 1/ 36 39 38 36 37 37 33 34<br />
A4. Alternative Scenario : No Oil Scenario 36 39 38 36 36 38 36 35<br />
B. Bound tests<br />
B1. Real GDP growth is at historical average minus one standard deviations in 2018-2019 36 39 39 37 37 38 33 31<br />
B2. Primary balance is at historical average minus one standard deviations in 2018-2019 36 39 38 36 36 37 31 28<br />
B3. Combination of B1-B2 using one half standard deviation shocks 36 39 38 36 37 37 32 29<br />
B4. One-time 30 percent real depreciation in 2018 36 40 42 39 40 39 35 34<br />
B5. 10 percent of GDP increase in other debt-creating flows in 2018 36 39 40 38 38 38 33 29<br />
Sources: Country authorities; and staff estimates and projections.<br />
1/ Assumes that real GDP growth is at baseline minus one standard deviation divided by the square root of the length of the projection period.<br />
2/ Revenues are defined inclusive of grants.<br />
14 INTERNATIONAL MONETARY FUND