


Create successful ePaper yourself
Turn your PDF publications into a flip-book with our unique Google optimized e-Paper software.
<strong>UGANDA</strong><br />
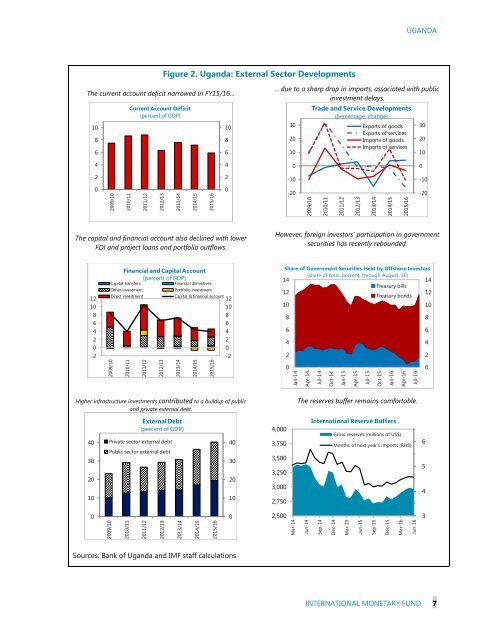
Figure 2. Uganda: External Sector Developments<br />
The current account deficit narrowed in FY15/16…<br />
10<br />
8<br />
6<br />
Current Account Deficit<br />
(percent of GDP)<br />
10<br />
8<br />
6<br />
… due to a sharp drop in imports, associated with public<br />
investment delays.<br />
30<br />
20<br />
10<br />
Trade and Service Developments<br />
(percentage change)<br />
Exports of goods<br />
Exports of services<br />
Imports of goods<br />
Imports of services<br />
30<br />
20<br />
10<br />
4<br />
4<br />
0<br />
0<br />
2<br />
2<br />
-10<br />
-10<br />
0<br />
2009/10<br />
2010/11<br />
2011/12<br />
2012/13<br />
2013/14<br />
2014/15<br />
2015/16<br />
0<br />
-20<br />
2009/10<br />
2010/11<br />
2011/12<br />
2012/13<br />
2013/14<br />
2014/15<br />
2015/16<br />
-20<br />
The capital and financial account also declined with lower<br />
FDI and project loans and portfolio outflows.<br />
However, foreign investors’ participation in government<br />
securities has recently rebounded.<br />
12<br />
10<br />
8<br />
6<br />
4<br />
2<br />
0<br />
-2<br />
Financial and Capital Account<br />
(percent of GDP)<br />
Capital transfers<br />
Financial derivatives<br />
Other investment<br />
Portfolio investment<br />
Direct investment<br />
Capital & financial account<br />
12<br />
10<br />
8<br />
6<br />
4<br />
2<br />
0<br />
-2<br />
2009/10<br />
2010/11<br />
2011/12<br />
2012/13<br />
2013/14<br />
2014/15<br />
2015/16<br />
Share of Government Securities Held by Offshore Investors<br />
14<br />
(share of total, percent, through August '16)<br />
14<br />
Treasury bills<br />
12<br />
Treasury bonds<br />
12<br />
10<br />
10<br />
8<br />
8<br />
6<br />
6<br />
4<br />
4<br />
2<br />
2<br />
0<br />
0<br />
Jan-14<br />
Apr-14<br />
Jul-14<br />
Oct-14<br />
Jan-15<br />
Apr-15<br />
Jul-15<br />
Oct-15<br />
Jan-16<br />
Apr-16<br />
Jul-16<br />
Higher infrastructure investments contributed to a buildup of public<br />
and private external debt.<br />
The reserves buffer remains comfortable.<br />
40<br />
30<br />
20<br />
10<br />
External Debt<br />
(percent of GDP)<br />
Private sector external debt<br />
Public sector external debt<br />
40<br />
30<br />
20<br />
10<br />
4,000<br />
3,750<br />
3,500<br />
3,250<br />
3,000<br />
2,750<br />
International Reserve Buffers<br />
Gross reserves (millions of US$)<br />
Months of next year's imports (RHS)<br />
6<br />
5<br />
4<br />
0<br />
2009/10<br />
2010/11<br />
2011/12<br />
2012/13<br />
2013/14<br />
2014/15<br />
2015/16<br />
0<br />
2,500<br />
Mar-14<br />
Jun-14<br />
Sep-14<br />
Dec-14<br />
Mar-15<br />
Jun-15<br />
Sep-15<br />
Dec-15<br />
Mar-16<br />
Jun-16<br />
3<br />
Sources: Bank of Uganda and IMF staff calculations.<br />
INTERNATIONAL MONETARY FUND 7