


You also want an ePaper? Increase the reach of your titles
YUMPU automatically turns print PDFs into web optimized ePapers that Google loves.
<strong>UGANDA</strong><br />
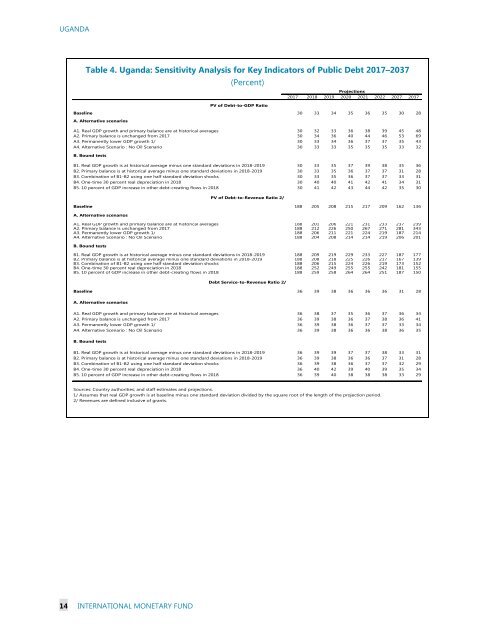
Table 4. Uganda: Sensitivity Analysis for Key Indicators of Public Debt 2017–2037<br />
(Percent)<br />
Projections<br />
2017 2018 2019 2020 2021 2022 2027 2037<br />
PV of Debt-to-GDP Ratio<br />
Baseline 30 33 34 35 36 35 30 28<br />
A. Alternative scenarios<br />
A1. Real GDP growth and primary balance are at historical averages 30 32 33 36 38 39 45 48<br />
A2. Primary balance is unchanged from 2017 30 34 36 40 44 46 53 69<br />
A3. Permanently lower GDP growth 1/ 30 33 34 36 37 37 35 43<br />
A4. Alternative Scenario : No Oil Scenario 30 33 33 35 35 35 33 32<br />
B. Bound tests<br />
B1. Real GDP growth is at historical average minus one standard deviations in 2018-2019 30 33 35 37 39 38 35 36<br />
B2. Primary balance is at historical average minus one standard deviations in 2018-2019 30 33 35 36 37 37 31 28<br />
B3. Combination of B1-B2 using one half standard deviation shocks 30 33 35 36 37 37 33 31<br />
B4. One-time 30 percent real depreciation in 2018 30 40 40 41 42 41 34 31<br />
B5. 10 percent of GDP increase in other debt-creating flows in 2018 30 41 42 43 44 42 35 30<br />
Baseline 188 205 208 215 217 209 162 136<br />
A. Alternative scenarios<br />
A1. Real GDP growth and primary balance are at historical averages 188 201 206 221 231 233 237 239<br />
A2. Primary balance is unchanged from 2017 188 212 226 250 267 271 281 343<br />
A3. Permanently lower GDP growth 1/ 188 206 211 221 224 219 187 214<br />
A4. Alternative Scenario : No Oil Scenario 188 204 208 214 214 219 206 201<br />
B. Bound tests<br />
PV of Debt-to-Revenue Ratio 2/<br />
B1. Real GDP growth is at historical average minus one standard deviations in 2018-2019 188 209 219 229 233 227 187 177<br />
B2. Primary balance is at historical average minus one standard deviations in 2018-2019 188 208 218 225 226 217 167 139<br />
B3. Combination of B1-B2 using one half standard deviation shocks 188 206 215 224 226 219 173 152<br />
B4. One-time 30 percent real depreciation in 2018 188 252 249 255 255 242 181 155<br />
B5. 10 percent of GDP increase in other debt-creating flows in 2018 188 259 258 264 264 251 187 150<br />
Debt Service-to-Revenue Ratio 2/<br />
Baseline 36 39 38 36 36 36 31 28<br />
A. Alternative scenarios<br />
A1. Real GDP growth and primary balance are at historical averages 36 38 37 35 36 37 36 34<br />
A2. Primary balance is unchanged from 2017 36 39 38 36 37 38 36 41<br />
A3. Permanently lower GDP growth 1/ 36 39 38 36 37 37 33 34<br />
A4. Alternative Scenario : No Oil Scenario 36 39 38 36 36 38 36 35<br />
B. Bound tests<br />
B1. Real GDP growth is at historical average minus one standard deviations in 2018-2019 36 39 39 37 37 38 33 31<br />
B2. Primary balance is at historical average minus one standard deviations in 2018-2019 36 39 38 36 36 37 31 28<br />
B3. Combination of B1-B2 using one half standard deviation shocks 36 39 38 36 37 37 32 29<br />
B4. One-time 30 percent real depreciation in 2018 36 40 42 39 40 39 35 34<br />
B5. 10 percent of GDP increase in other debt-creating flows in 2018 36 39 40 38 38 38 33 29<br />
Sources: Country authorities; and staff estimates and projections.<br />
1/ Assumes that real GDP growth is at baseline minus one standard deviation divided by the square root of the length of the projection period.<br />
2/ Revenues are defined inclusive of grants.<br />
14 INTERNATIONAL MONETARY FUND