


You also want an ePaper? Increase the reach of your titles
YUMPU automatically turns print PDFs into web optimized ePapers that Google loves.
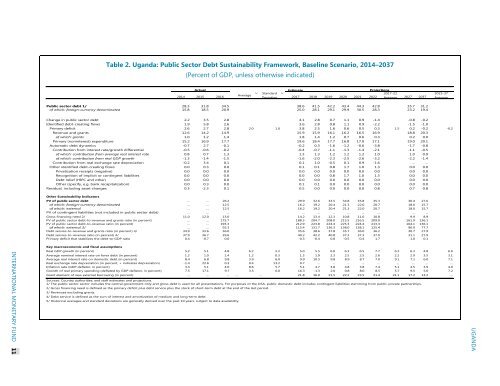
Table 2. Uganda: Public Sector Debt Sustainability Framework, Baseline Scenario, 2014–2037<br />
(Percent of GDP, unless otherwise indicated)<br />
Actual<br />
2014 2015 2016<br />
Average<br />
5/ Standard<br />
Deviation<br />
5/<br />
Estimate<br />
Projections<br />
2017-22<br />
2017 2018 2019 2020 2021 2022 Average 2027 2037<br />
2023-37<br />
Average<br />
Public sector debt 1/ 28.3 31.8 34.5 38.6 41.5 42.2 43.4 44.3 42.8 35.7 31.2<br />
of which: foreign-currency denominated 15.8 18.5 20.9 25.0 28.1 29.1 29.9 30.5 28.3 23.2 19.4<br />
Change in public sector debt 2.2 3.5 2.8 4.1 2.8 0.7 1.1 0.9 -1.4 -0.8 -0.2<br />
Identified debt-creating flows 1.9 5.8 2.6 3.6 2.8 0.8 1.1 0.9 -2.2 -1.5 -1.0<br />
Primary deficit 2.6 2.7 2.8 2.0 1.0 3.8 2.5 1.6 0.6 0.5 0.3 1.5 0.2 -0.2 -0.2<br />
Revenue and grants 12.6 14.2 14.9 15.9 15.9 16.1 16.2 16.5 16.9 18.8 20.3<br />
of which: grants 1.0 1.2 1.4 1.8 1.4 1.2 0.7 0.6 0.3 0.2 0.0<br />
Primary (noninterest) expenditure 15.2 16.9 17.7 19.6 18.4 17.7 16.8 17.0 17.1 19.0 20.1<br />
Automatic debt dynamics -0.7 2.7 -0.1 -0.2 0.3 -1.6 -1.2 -0.6 -3.8 -1.7 -0.8<br />
Contribution from interest rate/growth differential -0.5 -0.6 -0.2 -0.4 -0.7 -1.1 -1.3 -1.4 -2.1 -1.1 -0.5<br />
of which: contribution from average real interest rate 0.8 0.7 1.3 1.3 1.3 1.2 1.2 1.2 1.0 1.0 0.9<br />
of which: contribution from real GDP growth -1.3 -1.4 -1.5 -1.6 -2.0 -2.3 -2.5 -2.6 -3.2 -2.2 -1.4<br />
Contribution from real exchange rate depreciation -0.2 3.4 0.1 0.1 1.0 -0.5 0.1 0.9 -1.6 ... ...<br />
Other identified debt-creating flows 0.0 0.3 0.0 0.1 0.1 0.8 1.7 1.0 1.3 0.0 0.0<br />
Privatization receipts (negative) 0.0 0.0 0.0 0.0 0.0 0.0 0.0 0.0 0.0 0.0 0.0<br />
Recognition of implicit or contingent liabilities 0.0 0.0 0.0 0.0 0.0 0.8 1.7 1.0 1.3 0.0 0.0<br />
Debt relief (HIPC and other) 0.0 0.0 0.0 0.0 0.0 0.0 0.0 0.0 0.0 0.0 0.0<br />
Other (specify, e.g. bank recapitalization) 0.0 0.3 0.0 0.1 0.1 0.0 0.0 0.0 0.0 0.0 0.0<br />
Residual, including asset changes 0.3 -2.3 0.1 0.5 0.0 0.0 0.0 0.0 0.8 0.7 0.8<br />
Other Sustainability Indicators<br />
PV of public sector debt ... ... 26.2 29.9 32.6 33.5 34.8 35.8 35.3 30.4 27.6<br />
of which: foreign-currency denominated ... ... 12.5 16.2 19.2 20.4 21.3 22.0 20.7 18.0 15.7<br />
of which: external ... ... 12.5 16.2 19.2 20.4 21.3 22.0 20.7 18.0 15.7<br />
PV of contingent liabilities (not included in public sector debt) ... ... ... ... ... ... ... ... ... ... ...<br />
Gross financing need 2/ 11.0 12.0 13.0 14.2 13.4 12.3 10.8 11.0 10.8 9.9 8.9<br />
PV of public sector debt-to-revenue and grants ratio (in percent) … … 175.7 188.3 204.7 208.0 215.5 216.5 209.0 161.9 136.1<br />
PV of public sector debt-to-revenue ratio (in percent) … … 193.3 212.9 223.8 224.4 225.3 224.4 213.3 164.1 136.1<br />
of which: external 3/ … … 92.3 115.4 131.7 136.3 138.0 138.1 125.4 96.9 77.7<br />
Debt service-to-revenue and grants ratio (in percent) 4/ 34.9 33.6 36.0 35.6 38.6 37.8 35.7 36.0 36.2 30.7 27.9<br />
Debt service-to-revenue ratio (in percent) 4/ 37.9 36.7 39.6 40.2 42.2 40.8 37.3 37.3 37.0 31.1 27.9<br />
Primary deficit that stabilizes the debt-to-GDP ratio 0.4 -0.7 0.0 -0.3 -0.4 0.8 -0.5 -0.4 1.7 1.0 0.1<br />
INTERNATIONAL MONETARY FUND 11<br />
Key macroeconomic and fiscal assumptions<br />
Real GDP growth (in percent) 5.2 5.1 4.8 6.2 2.2 5.0 5.5 6.0 6.3 6.5 7.7 6.2 6.3 4.8 6.0<br />
Average nominal interest rate on forex debt (in percent) 1.2 1.0 1.4 1.2 0.3 1.5 1.9 2.3 2.5 2.5 2.6 2.2 2.9 3.5 3.1<br />
Average real interest rate on domestic debt (in percent) 8.4 6.8 9.8 3.9 6.0 9.9 10.5 9.8 8.9 8.7 7.0 9.1 7.1 6.0 7.1<br />
Real exchange rate depreciation (in percent, + indicates depreciation) -1.4 22.6 0.3 0.4 13.2 0.7 ... ... ... ... ... ... ... ... ...<br />
Inflation rate (GDP deflator, in percent) 3.4 5.1 4.0 8.6 5.7 5.1 4.7 4.8 4.8 3.8 7.4 5.1 4.5 3.9 4.0<br />
Growth of real primary spending (deflated by GDP deflator, in percent) 7.5 17.1 9.7 3.5 6.0 16.3 -1.3 2.0 0.8 8.0 8.5 5.7 9.5 5.0 7.2<br />
Grant element of new external borrowing (in percent) ... ... ... … … 21.8 16.0 21.5 22.2 23.5 21.4 21.1 17.2 13.2 ...<br />
Sources: Country authorities; and staff estimates and projections.<br />
1/ The public sector sector includes the central government only and gross debt is used for all presentations. For purposes of the DSA, public domestic debt includes contingent liabilities stemming from public-private partnerships.<br />
2/ Gross financing need is defined as the primary deficit plus debt service plus the stock of short-term debt at the end of the last period.<br />
3/ Revenues excluding grants.<br />
4/ Debt service is defined as the sum of interest and amortization of medium and long-term debt.<br />
5/ Historical averages and standard deviations are generally derived over the past 10 years, subject to data availability.<br />
<strong>UGANDA</strong>