


You also want an ePaper? Increase the reach of your titles
YUMPU automatically turns print PDFs into web optimized ePapers that Google loves.
<strong>UGANDA</strong><br />
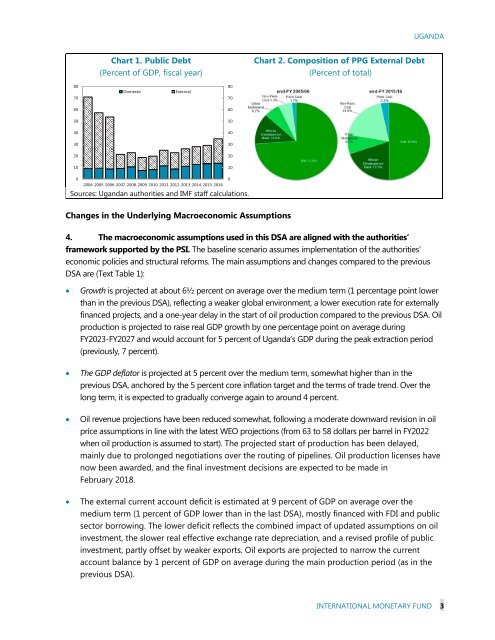
Chart 1. Public Debt<br />
(Percent of GDP, fiscal year)<br />
Chart 2. Composition of PPG External Debt<br />
(Percent of total)<br />
80<br />
Domestic<br />
External<br />
80<br />
70<br />
70<br />
60<br />
60<br />
50<br />
50<br />
40<br />
40<br />
30<br />
30<br />
20<br />
20<br />
10<br />
10<br />
0<br />
0<br />
2004 2005 2006 2007 2008 2009 2010 2011 2012 2013 2014 2015 2016<br />
Sources: Ugandan authorities and IMF staff calculations.<br />
Changes in the Underlying Macroeconomic Assumptions<br />
4. The macroeconomic assumptions used in this DSA are aligned with the authorities’<br />
framework supported by the PSI. The baseline scenario assumes implementation of the authorities’<br />
economic policies and structural reforms. The main assumptions and changes compared to the previous<br />
DSA are (Text Table 1):<br />
<br />
<br />
<br />
<br />
Growth is projected at about 6½ percent on average over the medium term (1 percentage point lower<br />
than in the previous DSA), reflecting a weaker global environment, a lower execution rate for externally<br />
financed projects, and a one-year delay in the start of oil production compared to the previous DSA. Oil<br />
production is projected to raise real GDP growth by one percentage point on average during<br />
FY2023-FY2027 and would account for 5 percent of Uganda’s GDP during the peak extraction period<br />
(previously, 7 percent).<br />
The GDP deflator is projected at 5 percent over the medium term, somewhat higher than in the<br />
previous DSA, anchored by the 5 percent core inflation target and the terms of trade trend. Over the<br />
long term, it is expected to gradually converge again to around 4 percent.<br />
Oil revenue projections have been reduced somewhat, following a moderate downward revision in oil<br />
price assumptions in line with the latest WEO projections (from 63 to 58 dollars per barrel in FY2022<br />
when oil production is assumed to start). The projected start of production has been delayed,<br />
mainly due to prolonged negotiations over the routing of pipelines. Oil production licenses have<br />
now been awarded, and the final investment decisions are expected to be made in<br />
February 2018.<br />
The external current account deficit is estimated at 9 percent of GDP on average over the<br />
medium term (1 percent of GDP lower than in the last DSA), mostly financed with FDI and public<br />
sector borrowing. The lower deficit reflects the combined impact of updated assumptions on oil<br />
investment, the slower real effective exchange rate depreciation, and a revised profile of public<br />
investment, partly offset by weaker exports. Oil exports are projected to narrow the current<br />
account balance by 1 percent of GDP on average during the main production period (as in the<br />
previous DSA).<br />
INTERNATIONAL MONETARY FUND 3