


You also want an ePaper? Increase the reach of your titles
YUMPU automatically turns print PDFs into web optimized ePapers that Google loves.
<strong>UGANDA</strong><br />
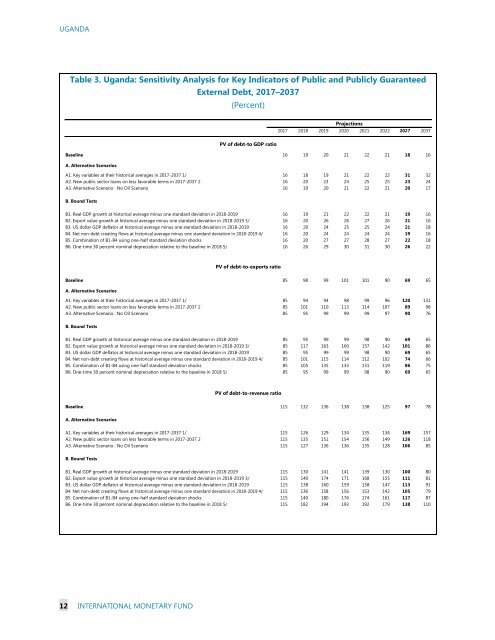
Table 3. Uganda: Sensitivity Analysis for Key Indicators of Public and Publicly Guaranteed<br />
External Debt, 2017–2037<br />
(Percent)<br />
Projections<br />
2017 2018 2019 2020 2021 2022 2027 2037<br />
PV of debt-to GDP ratio<br />
Baseline 16 19 20 21 22 21 18 16<br />
A. Alternative Scenarios<br />
A1. Key variables at their historical averages in 2017-2037 1/ 16 18 19 21 22 22 31 32<br />
A2. New public sector loans on less favorable terms in 2017-2037 2 16 20 23 24 25 25 23 24<br />
A3. Alternative Scenario : No Oil Scenario 16 19 20 21 22 21 20 17<br />
B. Bound Tests<br />
B1. Real GDP growth at historical average minus one standard deviation in 2018-2019 16 19 21 22 22 21 19 16<br />
B2. Export value growth at historical average minus one standard deviation in 2018-2019 3/ 16 20 26 26 27 26 21 16<br />
B3. US dollar GDP deflator at historical average minus one standard deviation in 2018-2019 16 20 24 25 25 24 21 18<br />
B4. Net non-debt creating flows at historical average minus one standard deviation in 2018-2019 4/ 16 20 24 24 24 24 19 16<br />
B5. Combination of B1-B4 using one-half standard deviation shocks 16 20 27 27 28 27 22 18<br />
B6. One-time 30 percent nominal depreciation relative to the baseline in 2018 5/ 16 26 29 30 31 30 26 22<br />
PV of debt-to-exports ratio<br />
Baseline 85 98 99 101 101 90 69 65<br />
A. Alternative Scenarios<br />
A1. Key variables at their historical averages in 2017-2037 1/ 85 94 94 98 99 96 120 131<br />
A2. New public sector loans on less favorable terms in 2017-2037 2 85 101 110 113 114 107 89 98<br />
A3. Alternative Scenario : No Oil Scenario 85 95 99 99 99 97 90 76<br />
B. Bound Tests<br />
B1. Real GDP growth at historical average minus one standard deviation in 2018-2019 85 95 99 99 98 90 69 65<br />
B2. Export value growth at historical average minus one standard deviation in 2018-2019 3/ 85 117 163 160 157 142 101 86<br />
B3. US dollar GDP deflator at historical average minus one standard deviation in 2018-2019 85 95 99 99 98 90 69 65<br />
B4. Net non-debt creating flows at historical average minus one standard deviation in 2018-2019 4/ 85 101 115 114 112 102 74 66<br />
B5. Combination of B1-B4 using one-half standard deviation shocks 85 105 135 133 131 119 86 75<br />
B6. One-time 30 percent nominal depreciation relative to the baseline in 2018 5/ 85 95 99 99 98 90 69 65<br />
PV of debt-to-revenue ratio<br />
Baseline 115 132 136 138 138 125 97 78<br />
A. Alternative Scenarios<br />
A1. Key variables at their historical averages in 2017-2037 1/ 115 126 129 134 135 134 169 157<br />
A2. New public sector loans on less favorable terms in 2017-2037 2 115 135 151 154 156 149 126 118<br />
A3. Alternative Scenario : No Oil Scenario 115 127 136 136 135 128 106 85<br />
B. Bound Tests<br />
B1. Real GDP growth at historical average minus one standard deviation in 2018-2019 115 130 141 141 139 130 100 80<br />
B2. Export value growth at historical average minus one standard deviation in 2018-2019 3/ 115 140 174 171 168 155 111 81<br />
B3. US dollar GDP deflator at historical average minus one standard deviation in 2018-2019 115 138 160 159 158 147 113 91<br />
B4. Net non-debt creating flows at historical average minus one standard deviation in 2018-2019 4/ 115 136 158 156 153 142 105 79<br />
B5. Combination of B1-B4 using one-half standard deviation shocks 115 140 180 176 174 161 117 87<br />
B6. One-time 30 percent nominal depreciation relative to the baseline in 2018 5/ 115 182 194 193 192 179 138 110<br />
12 INTERNATIONAL MONETARY FUND