


Create successful ePaper yourself
Turn your PDF publications into a flip-book with our unique Google optimized e-Paper software.
10 INTERNATIONAL MONETARY FUND<br />
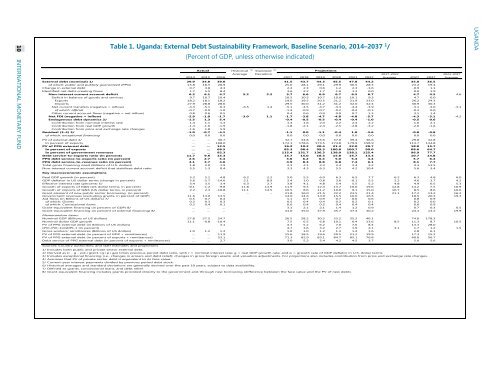
Table 1. Uganda: External Debt Sustainability Framework, Baseline Scenario, 2014–2037 1 /<br />
(Percent of GDP, unless otherwise indicated)<br />
6/<br />
Actual<br />
Historical Standard 6/<br />
Projections<br />
Average Deviation 2017-2022 2023-2037<br />
2014 2015 2016 2017 2018 2019 2020 2021 2022 Average 2027 2037 Average<br />
External debt (nominal) 1/ 29.9 34.8 39.0 41.5 43.7 44.3 45.5 47.8 44.2 35.0 36.5<br />
of which: public and publicly guaranteed (PPG) 15.8 18.5 20.9 25.0 28.1 29.1 29.9 30.5 28.3 23.2 19.4<br />
Change in external debt 0.7 4.8 4.3 2.4 2.3 0.6 1.2 2.3 -3.6 -0.9 1.1<br />
Identified net debt-creating flows 1.7 5.5 8.4 3.6 2.2 1.7 1.6 1.3 0.0 0.0 1.9<br />
Non-interest current account deficit 6.2 6.1 4.7 5.2 2.2 5.7 6.6 6.9 6.7 6.5 6.7 4.7 4.5 4.6<br />
Deficit in balance of goods and services 9.7 10.7 10.4 10.5 10.5 10.7 10.0 10.1 9.3 4.7 6.0<br />
Exports 18.2 18.1 18.2 19.0 19.5 20.5 21.2 21.9 23.0 26.2 24.3<br />
Imports 27.9 28.8 28.6 29.5 30.0 31.2 31.2 32.0 32.4 30.9 30.3<br />
Net current transfers (negative = inflow) -4.3 -5.1 -6.3 -6.5 1.4 -5.1 -4.5 -4.7 -4.3 -4.4 -3.9 -3.1 -3.0 -3.1<br />
of which: official -0.7 -0.9 -1.0 -1.4 -0.9 -0.7 -0.2 -0.4 -0.3 -0.2 0.0<br />
Other current account flows (negative = net inflow) 0.8 0.6 0.5 0.4 0.6 0.9 0.9 0.7 1.3 3.1 1.4<br />
Net FDI (negative = inflow) -2.9 -1.9 -1.7 -3.0 1.1 -1.7 -3.8 -4.7 -4.8 -4.8 -5.7 -4.3 -3.1 -4.2<br />
Endogenous debt dynamics 2/ -1.5 1.3 5.4 -0.4 -0.5 -0.5 -0.4 -0.4 -1.0 -0.5 0.6<br />
Contribution from nominal interest rate 1.4 1.1 1.3 1.4 1.6 2.0 2.2 2.4 2.2 1.6 2.1<br />
Contribution from real GDP growth -1.4 -1.6 -1.9 -1.8 -2.1 -2.4 -2.5 -2.8 -3.2 -2.0 -1.6<br />
Contribution from price and exchange rate changes -1.6 1.8 5.9 … … … … … … … …<br />
Residual (3-4) 3/ -1.0 -0.7 -4.1 -1.1 0.0 -1.1 -0.4 1.0 -3.6 -0.8 -0.8<br />
of which: exceptional financing 0.0 0.0 0.0 0.0 0.0 0.0 0.0 0.0 0.0 0.0 0.0<br />
PV of external debt 4/ ... ... 30.7 32.7 34.8 35.6 37.0 39.4 36.6 29.8 32.8<br />
In percent of exports ... ... 168.0 172.1 178.6 173.5 174.8 179.9 158.9 113.7 134.8<br />
PV of PPG external debt ... ... 12.5 16.2 19.2 20.4 21.3 22.0 20.7 18.0 15.7<br />
In percent of exports ... ... 68.5 85.3 98.4 99.3 100.8 100.7 90.0 68.6 64.7<br />
In percent of government revenues ... ... 92.3 115.4 131.7 136.3 138.0 138.1 125.4 96.9 77.7<br />
Debt service-to-exports ratio (in percent) 11.7 9.6 15.3 15.7 15.0 18.3 15.8 15.7 13.3 10.7 14.8<br />
PPG debt service-to-exports ratio (in percent) 2.6 2.7 3.4 3.6 6.2 6.4 5.0 5.4 4.4 5.7 6.4<br />
PPG debt service-to-revenue ratio (in percent) 4.1 3.7 4.6 4.9 8.3 8.8 6.8 7.4 6.1 8.1 7.7<br />
Total gross financing need (Billions of U.S. dollars) 1.8 2.0 1.9 2.3 2.1 2.3 2.3 2.4 2.2 4.3 13.5<br />
Non-interest current account deficit that stabilizes debt ratio 5.5 1.3 0.4 3.3 4.3 6.3 5.5 4.2 10.4 5.6 3.4<br />
Key macroeconomic assumptions<br />
Real GDP growth (in percent) 5.2 5.1 4.8 6.2 2.2 5.0 5.5 6.0 6.3 6.5 7.7 6.2 6.3 4.8 6.0<br />
GDP deflator in US dollar terms (change in percent) 5.6 -5.7 -14.6 2.1 8.9 2.4 1.0 0.8 3.6 -0.1 5.5 2.2 4.6 3.7 4.2<br />
Effective interest rate (percent) 5/ 5.4 3.5 3.4 6.3 2.7 3.8 4.1 4.8 5.4 5.5 5.2 4.8 4.9 6.5 5.3<br />
Growth of exports of G&S (US dollar terms, in percent) -0.1 -1.2 -9.8 11.8 13.9 11.9 9.3 12.4 13.7 10.0 19.6 12.8 14.2 7.5 10.9<br />
Growth of imports of G&S (US dollar terms, in percent) 2.2 2.3 -10.8 11.1 14.5 10.5 8.6 11.2 10.0 9.1 15.0 10.7 8.5 8.6 10.0<br />
Grant element of new public sector borrowing (in percent) ... ... ... ... ... 21.8 16.0 21.5 22.2 23.5 21.4 21.1 17.2 13.2 16.2<br />
Government revenues (excluding grants, in percent of GDP) 11.6 13.0 13.5 14.0 14.6 14.9 15.5 16.0 16.5 18.5 20.3 19.3<br />
Aid flows (in Billions of US dollars) 7/ 0.5 0.7 0.4 1.1 0.7 0.9 0.7 0.6 0.6 0.8 0.9<br />
of which: Grants 0.3 0.3 0.3 0.5 0.4 0.4 0.2 0.2 0.1 0.2 0.0<br />
of which: Concessional loans 0.2 0.4 0.1 0.6 0.4 0.5 0.4 0.4 0.4 0.6 0.9<br />
Grant-equivalent financing (in percent of GDP) 8/ ... ... ... 3.1 2.1 2.1 1.4 1.2 0.9 0.7 0.3 0.5<br />
Grant-equivalent financing (in percent of external financing) 8/ ... ... ... 41.0 35.0 37.9 35.7 37.4 30.2 24.3 13.2 19.9<br />
Memorandum items:<br />
Nominal GDP (Billions of US dollars) 27.8 27.5 24.7 26.5 28.2 30.2 33.2 35.3 40.1 74.0 178.3<br />
Nominal dollar GDP growth 11.1 -0.8 -10.4 7.5 6.5 6.8 10.1 6.4 13.6 8.5 11.3 8.7 10.5<br />
PV of PPG external debt (in Billions of US dollars) 3.1 4.3 5.2 6.2 7.0 7.6 8.4 13.3 28.0<br />
(PVt-PVt-1)/GDPt-1 (in percent) 4.7 3.6 3.2 2.7 1.9 2.1 3.1 1.7 1.2 1.5<br />
Gross workers' remittances (Billions of US dollars) 1.0 1.2 1.3 1.0 1.0 1.2 1.3 1.4 1.6 2.8 6.1<br />
PV of PPG external debt (in percent of GDP + remittances) ... ... 11.9 15.6 18.5 19.6 20.5 21.2 19.9 17.3 15.2<br />
PV of PPG external debt (in percent of exports + remittances) ... ... 53.1 71.3 82.9 83.1 84.7 85.1 76.8 60.0 56.7<br />
Debt service of PPG external debt (in percent of exports + remittances) ... ... 2.7 3.0 5.2 5.4 4.2 4.5 3.7 5.0 5.6<br />
Sources: Country authorities; and staff estimates and projections.<br />
1/ Includes both public and private sector external debt.<br />
2/ Derived as [r - g - ρ(1+g)]/(1+g+ρ+gρ) times previous period debt ratio, with r = nominal interest rate; g = real GDP growth rate, and ρ = growth rate of GDP deflator in U.S. dollar terms.<br />
3/ Includes exceptional financing (i.e., changes in arrears and debt relief); changes in gross foreign assets; and valuation adjustments. For projections also includes contribution from price and exchange rate changes.<br />
4/ Assumes that PV of private sector debt is equivalent to its face value.<br />
5/ Current-year interest payments divided by previous period debt stock.<br />
6/ Historical averages and standard deviations are generally derived over the past 10 years, subject to data availability.<br />
7/ Defined as grants, concessional loans, and debt relief.<br />
8/ Grant-equivalent financing includes grants provided directly to the government and through new borrowing (difference between the face value and the PV of new debt).<br />
<strong>UGANDA</strong>