


Create successful ePaper yourself
Turn your PDF publications into a flip-book with our unique Google optimized e-Paper software.
26 INTERNATIONAL MONETARY FUND<br />
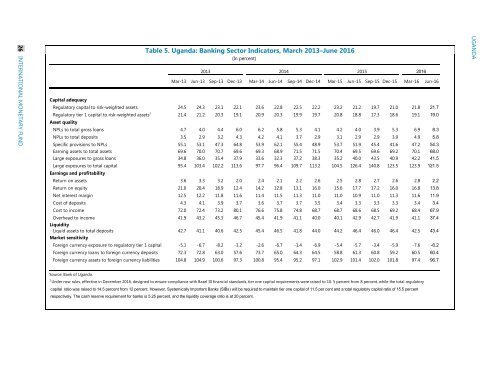
Table 5. Uganda: Banking Sector Indicators, March 2013–June 2016<br />
(In percent)<br />
2013 2014<br />
2015<br />
Mar-13 Jun-13 Sep-13 Dec-13 Mar-14 Jun-14 Sep-14 Dec-14 Mar-15 Jun-15 Sep-15 Dec-15 Mar-16 Jun-16<br />
Capital adequacy<br />
Regulatory capital to risk-weighted assets 24.5 24.3 23.1 22.1 23.6 22.8 22.5 22.2 23.2 21.2 19.7 21.0 21.8 21.7<br />
Regulatory tier 1 capital to risk-weighted assets 1 21.4 21.2 20.3 19.1 20.9 20.3 19.9 19.7 20.8 18.8 17.3 18.6 19.1 19.0<br />
Asset quality<br />
NPLs to total gross loans 4.7 4.0 4.4 6.0 6.2 5.8 5.3 4.1 4.2 4.0 3.9 5.3 6.9 8.3<br />
NPLs to total deposits 3.5 2.9 3.2 4.3 4.2 4.1 3.7 2.9 3.1 2.9 2.9 3.9 4.9 5.8<br />
Specific provisions to NPLs 55.1 53.1 47.3 64.8 53.9 62.1 55.4 48.9 53.7 51.9 45.4 41.6 47.2 54.3<br />
Earning assets to total assets 69.6 70.0 70.7 69.6 69.3 68.9 71.5 71.5 70.4 69.5 69.6 69.2 70.1 68.0<br />
Large exposures to gross loans 34.8 36.0 35.4 37.9 33.6 32.3 37.2 38.3 35.2 40.0 43.5 40.9 42.2 41.5<br />
Large exposures to total capital 95.4 103.4 102.2 113.6 97.7 96.4 109.7 113.2 104.5 126.4 140.8 123.5 123.9 121.5<br />
Earnings and profitability<br />
Return on assets 3.6 3.3 3.2 2.0 2.4 2.1 2.2 2.6 2.5 2.8 2.7 2.6 2.8 2.2<br />
Return on equity 21.0 20.4 18.9 12.4 14.2 12.8 13.1 16.0 15.6 17.7 17.2 16.0 16.8 13.8<br />
Net interest margin 12.5 12.2 11.8 11.6 11.4 11.5 11.3 11.0 11.0 10.9 11.0 11.3 11.6 11.9<br />
Cost of deposits 4.3 4.1 3.9 3.7 3.6 3.7 3.7 3.5 3.4 3.3 3.3 3.3 3.4 3.4<br />
Cost to income 72.0 72.4 73.2 80.1 76.6 75.8 74.8 68.7 68.7 68.6 68.5 69.2 68.4 67.9<br />
Overhead to income 41.9 43.2 45.3 46.7 45.4 41.9 41.1 40.0 40.1 42.9 42.7 41.9 41.1 37.4<br />
Liquidity<br />
Liquid assets to total deposits 42.7 41.1 40.6 42.5 45.4 46.5 41.8 44.0 44.2 46.4 46.0 46.4 42.5 43.4<br />
Market sensitivity<br />
Foreign currency exposure to regulatory tier 1 capital -5.1 -6.7 -8.2 -3.2 -2.6 -6.7 -1.4 -6.9 -5.4 -5.7 -3.4 -5.9 -7.6 -6.2<br />
Foreign currency loans to foreign currency deposits 72.3 72.8 63.0 57.6 73.7 65.0 64.3 64.5 58.8 61.3 60.8 59.2 60.5 60.4<br />
Foreign currency assets to foreign currency liabilities 104.8 104.9 100.6 97.3 100.8 95.4 95.2 97.1 102.9 101.4 102.0 101.8 97.4 96.7<br />
2016<br />
<strong>UGANDA</strong><br />
Source: Bank of Uganda.<br />
1<br />
Under new rules, effective in December 2016, designed to ensure compliance with Basel III financial standards, tier one capital requirements were raised to 10. 5 percent from 8 percent, while the total regulatory<br />
capital ratio was raised to 14.5 percent from 12 percent. However, Systemically Important Banks (SIBs) will be required to maintain tier one capital of 11.5 per cent and a total regulatory capital ratio of 15.5 percent<br />
respectively. The cash reserve requirement for banks is 5.25 percent, and the liquidity coverage ratio is at 20 percent.