


You also want an ePaper? Increase the reach of your titles
YUMPU automatically turns print PDFs into web optimized ePapers that Google loves.
<strong>UGANDA</strong><br />
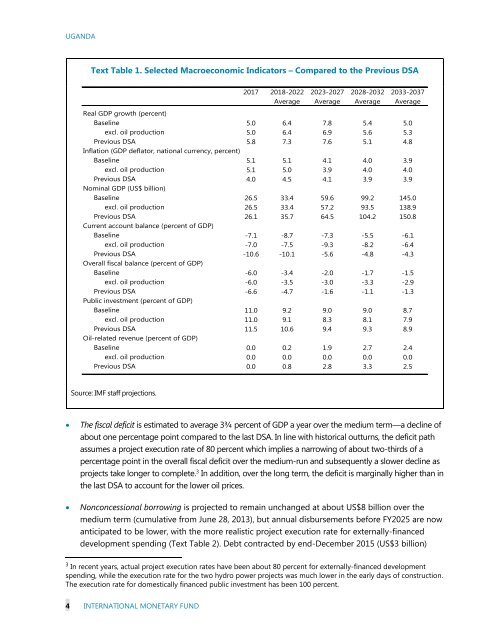
Text Table 1. Selected Macroeconomic Indicators – Compared to the Previous DSA<br />
2017 2018-2022 2023-2027 2028-2032 2033-2037<br />
Average Average Average Average<br />
Real GDP growth (percent)<br />
Baseline 5.0 6.4 7.8 5.4 5.0<br />
excl. oil production 5.0 6.4 6.9 5.6 5.3<br />
Previous DSA 5.8 7.3 7.6 5.1 4.8<br />
Inflation (GDP deflator, national currency, percent)<br />
Baseline 5.1 5.1 4.1 4.0 3.9<br />
excl. oil production 5.1 5.0 3.9 4.0 4.0<br />
Previous DSA 4.0 4.5 4.1 3.9 3.9<br />
Nominal GDP (US$ billion)<br />
Baseline 26.5 33.4 59.6 99.2 145.0<br />
excl. oil production 26.5 33.4 57.2 93.5 138.9<br />
Previous DSA 26.1 35.7 64.5 104.2 150.8<br />
Current account balance (percent of GDP)<br />
Baseline -7.1 -8.7 -7.3 -5.5 -6.1<br />
excl. oil production -7.0 -7.5 -9.3 -8.2 -6.4<br />
Previous DSA -10.6 -10.1 -5.6 -4.8 -4.3<br />
Overall fiscal balance (percent of GDP)<br />
Baseline -6.0 -3.4 -2.0 -1.7 -1.5<br />
excl. oil production -6.0 -3.5 -3.0 -3.3 -2.9<br />
Previous DSA -6.6 -4.7 -1.6 -1.1 -1.3<br />
Public investment (percent of GDP)<br />
Baseline 11.0 9.2 9.0 9.0 8.7<br />
excl. oil production 11.0 9.1 8.3 8.1 7.9<br />
Previous DSA 11.5 10.6 9.4 9.3 8.9<br />
Oil-related revenue (percent of GDP)<br />
Baseline 0.0 0.2 1.9 2.7 2.4<br />
excl. oil production 0.0 0.0 0.0 0.0 0.0<br />
Previous DSA 0.0 0.8 2.8 3.3 2.5<br />
Source: IMF staff projections.<br />
<br />
<br />
The fiscal deficit is estimated to average 3¾ percent of GDP a year over the medium term—a decline of<br />
about one percentage point compared to the last DSA. In line with historical outturns, the deficit path<br />
assumes a project execution rate of 80 percent which implies a narrowing of about two-thirds of a<br />
percentage point in the overall fiscal deficit over the medium-run and subsequently a slower decline as<br />
projects take longer to complete. 3 In addition, over the long term, the deficit is marginally higher than in<br />
the last DSA to account for the lower oil prices.<br />
Nonconcessional borrowing is projected to remain unchanged at about US$8 billion over the<br />
medium term (cumulative from June 28, 2013), but annual disbursements before FY2025 are now<br />
anticipated to be lower, with the more realistic project execution rate for externally-financed<br />
development spending (Text Table 2). Debt contracted by end-December 2015 (US$3 billion)<br />
3<br />
In recent years, actual project execution rates have been about 80 percent for externally-financed development<br />
spending, while the execution rate for the two hydro power projects was much lower in the early days of construction.<br />
The execution rate for domestically financed public investment has been 100 percent.<br />
4 INTERNATIONAL MONETARY FUND