CLOSING THE GAP
ctg-report-2017
ctg-report-2017

You also want an ePaper? Increase the reach of your titles
YUMPU automatically turns print PDFs into web optimized ePapers that Google loves.
Target: Close the gap between<br />
Indigenous and non-Indigenous school<br />
attendance within five years (by 2018).<br />
KEY POINTS<br />
• Recognising the critical importance of school<br />
attendance, both government and non-government<br />
education authorities will continue to work with<br />
communities and families to encourage and<br />
support children going to school regularly.<br />
• In 2016, the overall attendance rate for Indigenous<br />
students nationally was 83.4 per cent, compared<br />
with 93.1 per cent for non-Indigenous students.<br />
• There has been no meaningful change in the<br />
national Indigenous school attendance rate<br />
from 2014 (83.5 per cent) to 2016 (83.4 per<br />
cent). Progress will need to accelerate across<br />
most jurisdictions for this target to be met.<br />
• School attendance for Indigenous students decreases<br />
with remoteness. In 2016, Indigenous attendance<br />
rates ranged from 86.9 per cent in inner regional<br />
areas to 66.4 per cent in very remote areas.<br />
• Schools selected for the Remote School Attendance<br />
Strategy (RSAS) generally had a history of low<br />
and declining attendance rates over a number<br />
of years. RSAS is addressing these declining<br />
rates of school attendance and the majority of<br />
RSAS schools had a higher attendance rate in<br />
Semester 1 2016 compared to Semester 1 2013.<br />
WHAT <strong>THE</strong> DATA TELLS US<br />
In Semester 1 2016, the national school attendance<br />
rate (Year 1 to 10) was 92.5 per cent; however, there is<br />
a sizable gap between Indigenous and non-Indigenous<br />
students. In 2016, the attendance rate for Indigenous<br />
students was 83.4 per cent, almost 10 percentage<br />
points lower than the comparable rate for<br />
non-Indigenous students (93.1 per cent). While this<br />
is a sizeable gap, the data tell us that on a given<br />
school day the majority of Aboriginal and Torres<br />
Strait Islander students are attending school.<br />
There has been negligible change in the rate of school<br />
attendance for Aboriginal and Torres Strait Islander<br />
children from 2014 (83.5 per cent) to 2016 (83.4 per cent).<br />
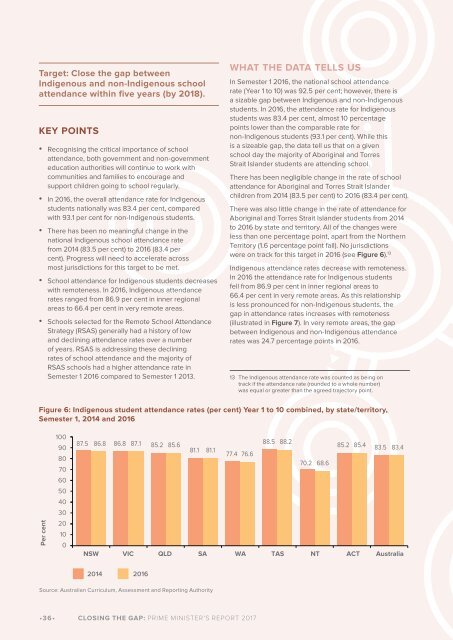
There was also little change in the rate of attendance for<br />
Aboriginal and Torres Strait Islander students from 2014<br />
to 2016 by state and territory. All of the changes were<br />
less than one percentage point, apart from the Northern<br />
Territory (1.6 percentage point fall). No jurisdictions<br />
were on track for this target in 2016 (see Figure 6). 13<br />
Indigenous attendance rates decrease with remoteness.<br />
In 2016 the attendance rate for Indigenous students<br />
fell from 86.9 per cent in inner regional areas to<br />
66.4 per cent in very remote areas. As this relationship<br />
is less pronounced for non-Indigenous students, the<br />
gap in attendance rates increases with remoteness<br />
(illustrated in Figure 7). In very remote areas, the gap<br />
between Indigenous and non-Indigenous attendance<br />
rates was 24.7 percentage points in 2016.<br />
13 The Indigenous attendance rate was counted as being on<br />
track if the attendance rate (rounded to a whole number)<br />
was equal or greater than the agreed trajectory point.<br />
Figure 6: Indigenous student attendance rates (per cent) Year 1 to 10 combined, by state/territory,<br />
Semester 1, 2014 and 2016<br />
Per cent<br />
100<br />
90<br />
80<br />
70<br />
60<br />
50<br />
40<br />
30<br />
20<br />
10<br />
0<br />
87.5 86.8 86.8 87.1 85.2 85.6<br />
88.5 88.2<br />
85.2 85.4<br />
81.1 81.1<br />
83.5 83.4<br />
77.4 76.6<br />
70.2 68.6<br />
NSW VIC QLD SA WA TAS NT ACT Australia<br />
2014<br />
2016<br />
Source: Australian Curriculum, Assessment and Reporting Authority<br />
•36• <strong>CLOSING</strong> <strong>THE</strong> <strong>GAP</strong>: PRIME MINISTER'S REPORT 2017