CLOSING THE GAP
ctg-report-2017
ctg-report-2017

Create successful ePaper yourself
Turn your PDF publications into a flip-book with our unique Google optimized e-Paper software.
and is therefore, on track. In all other jurisdictions<br />
the gap in employment rates significantly increased<br />
during this time, apart from Victoria where the<br />
increase was not statistically significant.<br />
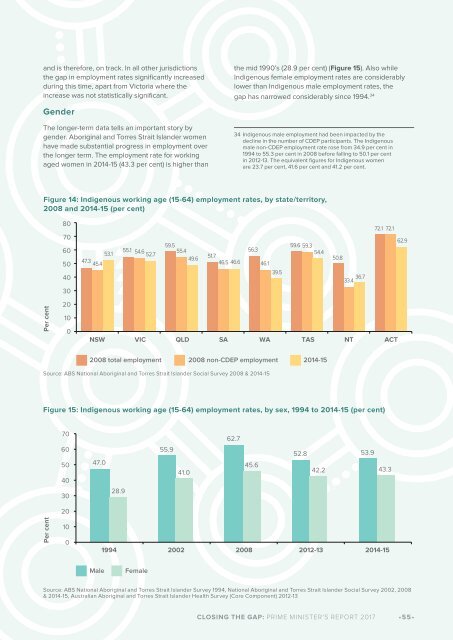
Gender<br />
The longer-term data tells an important story by<br />
gender. Aboriginal and Torres Strait Islander women<br />
have made substantial progress in employment over<br />
the longer term. The employment rate for working<br />
aged women in 2014-15 (43.3 per cent) is higher than<br />
the mid 1990’s (28.9 per cent) (Figure 15). Also while<br />
Indigenous female employment rates are considerably<br />
lower than Indigenous male employment rates, the<br />
gap has narrowed considerably since 1994. 34<br />
34 Indigenous male employment had been impacted by the<br />
decline in the number of CDEP participants. The Indigenous<br />
male non-CDEP employment rate rose from 34.9 per cent in<br />
1994 to 55.3 per cent in 2008 before falling to 50.1 per cent<br />
in 2012-13. The equivalent figures for Indigenous women<br />
are 23.7 per cent, 41.6 per cent and 41.2 per cent.<br />
Figure 14: Indigenous working age (15-64) employment rates, by state/territory,<br />
2008 and 2014-15 (per cent)<br />
80<br />
70<br />
60<br />
50<br />
40<br />
30<br />
47.3<br />
45.4<br />
55.1<br />
53.1 54.6<br />
52.7<br />
59.5<br />
55.4<br />
49.6<br />
56.3<br />
51.7<br />
46.5 46.6 46.1<br />
39.5<br />
59.6 59.3<br />
54.4<br />
50.8<br />
36.7<br />
33.4<br />
72.1 72.1<br />
62.9<br />
Per cent<br />
20<br />
10<br />
0<br />
NSW VIC QLD SA WA TAS NT ACT<br />
2008 total employment<br />
2008 non-CDEP employment<br />
2014-15<br />
Source: ABS National Aboriginal and Torres Strait Islander Social Survey 2008 & 2014-15<br />
Figure 15: Indigenous working age (15-64) employment rates, by sex, 1994 to 2014-15 (per cent)<br />
70<br />
60<br />
50<br />
40<br />
30<br />
47.0<br />
28.9<br />
55.9<br />
41.0<br />
62.7<br />
45.6<br />
52.8 53.9<br />
42.2 43.3<br />
20<br />
Per cent<br />
10<br />
0<br />
1994 2002 2008 2012-13 2014-15<br />
Male<br />
Female<br />
Source: ABS National Aboriginal and Torres Strait Islander Survey 1994, National Aboriginal and Torres Strait Islander Social Survey 2002, 2008<br />
& 2014-15, Australian Aboriginal and Torres Strait Islander Health Survey (Core Component) 2012-13<br />
<strong>CLOSING</strong> <strong>THE</strong> <strong>GAP</strong>: PRIME MINISTER'S REPORT 2017<br />
•55•