CLOSING THE GAP
ctg-report-2017
ctg-report-2017

You also want an ePaper? Increase the reach of your titles
YUMPU automatically turns print PDFs into web optimized ePapers that Google loves.
Australians have almost certainly been more<br />
adversely affected by recent cyclical softness in the<br />
labour market” (Productivity Commission, 2015).<br />
Another important factor in the fall in the Indigenous<br />
employment rate is the gradual cessation of Community<br />
Development Employment Projects (CDEP), in June 2015.<br />
During the life of the program, the ABS classified CDEP<br />
participants as being employed. 33 Job seekers previously<br />
eligible for CDEP are now supported into work-like<br />
activities through jobactive and Disability Employment<br />
Services (in urban and regional areas) and the<br />
Community Development Programme (in remote areas),<br />
however are no longer classified as being employed.<br />
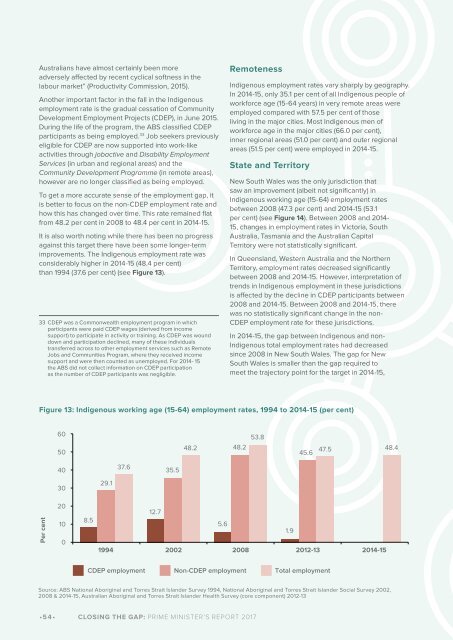
To get a more accurate sense of the employment gap, it<br />
is better to focus on the non-CDEP employment rate and<br />
how this has changed over time. This rate remained flat<br />
from 48.2 per cent in 2008 to 48.4 per cent in 2014-15.<br />
It is also worth noting while there has been no progress<br />
against this target there have been some longer-term<br />
improvements. The Indigenous employment rate was<br />
considerably higher in 2014-15 (48.4 per cent)<br />
than 1994 (37.6 per cent) (see Figure 13).<br />
33 CDEP was a Commonwealth employment program in which<br />
participants were paid CDEP wages (derived from income<br />
support) to participate in activity or training. As CDEP was wound<br />
down and participation declined, many of these individuals<br />
transferred across to other employment services such as Remote<br />
Jobs and Communities Program, where they received income<br />
support and were then counted as unemployed. For 2014- 15<br />
the ABS did not collect information on CDEP participation<br />
as the number of CDEP participants was negligible.<br />
Remoteness<br />
Indigenous employment rates vary sharply by geography.<br />
In 2014-15, only 35.1 per cent of all Indigenous people of<br />
workforce age (15-64 years) in very remote areas were<br />
employed compared with 57.5 per cent of those<br />
living in the major cities. Most Indigenous men of<br />
workforce age in the major cities (66.0 per cent),<br />
inner regional areas (51.0 per cent) and outer regional<br />
areas (51.5 per cent) were employed in 2014-15.<br />
State and Territory<br />
New South Wales was the only jurisdiction that<br />
saw an improvement (albeit not significantly) in<br />
Indigenous working age (15-64) employment rates<br />
between 2008 (47.3 per cent) and 2014-15 (53.1<br />
per cent) (see Figure 14). Between 2008 and 2014-<br />
15, changes in employment rates in Victoria, South<br />
Australia, Tasmania and the Australian Capital<br />
Territory were not statistically significant.<br />
In Queensland, Western Australia and the Northern<br />
Territory, employment rates decreased significantly<br />
between 2008 and 2014-15. However, interpretation of<br />
trends in Indigenous employment in these jurisdictions<br />
is affected by the decline in CDEP participants between<br />
2008 and 2014-15. Between 2008 and 2014-15, there<br />
was no statistically significant change in the non-<br />
CDEP employment rate for these jurisdictions.<br />
In 2014-15, the gap between Indigenous and non-<br />
Indigenous total employment rates had decreased<br />
since 2008 in New South Wales. The gap for New<br />
South Wales is smaller than the gap required to<br />
meet the trajectory point for the target in 2014-15,<br />
Figure 13: Indigenous working age (15-64) employment rates, 1994 to 2014-15 (per cent)<br />
60<br />
50<br />
48.2<br />
48.2<br />
53.8<br />
45.6<br />
47.5 48.4<br />
40<br />
37.6<br />
35.5<br />
30<br />
29.1<br />
Per cent<br />
20<br />
10<br />
0<br />
8.5<br />
12.7<br />
5.6<br />
1.9<br />
1994 2002 2008 2012-13 2014-15<br />
CDEP employment<br />
Non-CDEP employment<br />
Total employment<br />
Source: ABS National Aboriginal and Torres Strait Islander Survey 1994, National Aboriginal and Torres Strait Islander Social Survey 2002,<br />
2008 & 2014-15, Australian Aboriginal and Torres Strait Islander Health Survey (core component) 2012-13<br />
•54• <strong>CLOSING</strong> <strong>THE</strong> <strong>GAP</strong>: PRIME MINISTER'S REPORT 2017