Preferential Adsorption and Co-nonsolvency of ... - au one net
Preferential Adsorption and Co-nonsolvency of ... - au one net
Preferential Adsorption and Co-nonsolvency of ... - au one net

Create successful ePaper yourself
Turn your PDF publications into a flip-book with our unique Google optimized e-Paper software.
Macromolecules ARTICLE<br />
We prepared the samples by mixing the solutions <strong>of</strong> PNIPAM<br />
(1.0 g L -1 )in water <strong>and</strong> PNIPAM (1.0 g L -1 ) in methanol. The<br />
amount <strong>of</strong> the solutions was measured by weight. Cloud points<br />
were determined by the detection <strong>of</strong> changes in turbidity <strong>of</strong><br />
solutions heated at a constant rate (0.2 °C min -1 for most<br />
samples, 0.5 °C min -1 for several samples with a very wide phase<br />
transition temperature scale). Turbidity was measured with UV<br />
spectrometer. Both the inflection points in the absorbancetemperature<br />
plots <strong>and</strong> the 90% transmittance points in the<br />
transmittance-temperature plots were chosen as the LCST<br />
<strong>and</strong> plotted as a function <strong>of</strong> the methanol volume fraction.<br />
Details <strong>of</strong> the experimental part will be reported in our forthcoming<br />
paper. 32<br />
The inflection points in the absorbance-temperature plots for<br />
polymers <strong>of</strong> different molecular weights are plotted in Figure 9a.<br />
The data (symbols) show a systematic shift to deeper minimum<br />
<strong>and</strong> larger methanol fraction with increase in the molecular<br />
weight. The fitting the LCST data by theoretical calculation<br />
(solid lines) <strong>of</strong> the spinodal curve for cooperative H-bonding is<br />
also shown. The concentration <strong>of</strong> the polymer is fixed at 1 g L -1<br />
in the experiment, while the molecular weight is changed from<br />
curve to curve. The parameters used are n A =1,n B =2,σ A = 0.30,<br />
σB = 0.42, γA = γB = 3.5, λA0 = 0.002, <strong>and</strong> λB0 = 0.004. The<br />
interaction parameters are eq 5.11 <strong>and</strong> χB = 0.34, χAB =0.<br />
We have neglected the H-bonding between water <strong>and</strong> methanol<br />
<strong>and</strong> assumed χAB = 0 bec<strong>au</strong>se water <strong>and</strong> methanol are<br />
completely miscible. Although this is a crude treatment <strong>of</strong> the<br />
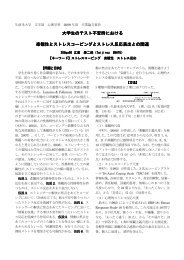
Figure 8. Definitions <strong>of</strong> the cloud point depression ΔTmin <strong>and</strong> the<br />
composition xm the lowest cloud temperature.<br />
water/methanol mixture, it seems that p-w <strong>and</strong> p-m H-bonds<br />
play the dominant role for the molecular weight dependence <strong>of</strong><br />
co-<strong>nonsolvency</strong>. However, the effect <strong>of</strong> water-methanol clustering<br />
remains an open question.<br />
Bec<strong>au</strong>se we know from the literature 33 that the spinodal line<br />
deviates upwards substantially from the cloud point curve in the<br />
very dilute region, we have fixed the volume fraction <strong>of</strong> the<br />
polymer at the value φ = 0.1, larger than the actual experiment. In<br />
the region between φ = 0.001 <strong>and</strong> φ = 0.2, LCST in pure water is<br />
almost independent <strong>of</strong> the polymer concentration, but the<br />
polymer concentration may c<strong>au</strong>se a pr<strong>of</strong>ound effect, such as<br />
merging <strong>of</strong> LCST <strong>and</strong> UCST as seen in Figure 6a, <strong>and</strong> should be<br />
studied in detail.<br />
For high molecular polymers (Mw = 200 kg mol -1 ) deviation<br />
<strong>of</strong> the LCST from the spinodal is large due to the predicted DCP<br />
formation as shown in in Figure 9b. Therefore, we have not tried<br />
the fitting in Figure 9a. The appearance <strong>of</strong> a DCP, followed by<br />
formation <strong>of</strong> an hourglass phase separation region, has not been<br />
observed in water/methanol mixture, but the phase separation<br />
regions identifiable to be hourglass are reported for water/<br />
ethanol <strong>and</strong> water/propanol mixtures. 31<br />
The cloud point depression <strong>and</strong> the minimum composition<br />
are plotted against the reciprocal molecular weight in Figure 9b.<br />
For the molecular weights below 50 kg mol -1 , ΔTmin falls on a<br />
straight line, although the data for larger molecular weight deviate<br />
from this line. The large positive deviation indicates that the<br />
cloud point temperature goes down lower than that expected by<br />
simple extrapolation due to the DCP formation. The UCST co<strong>nonsolvency</strong><br />
accelerates the downward shift <strong>of</strong> the LCST.<br />
7. CONCLUSIONS AND DISCUSSION<br />
We have developed a new theoretical framework capable <strong>of</strong><br />
studying polymers in mixed solvents in which polymer <strong>and</strong><br />
solvents strongly interact. The special case <strong>of</strong> competitive Hbonding<br />
between the polymer <strong>and</strong> the two solvents is studied in<br />
detail, <strong>and</strong> the results were applied to the co-<strong>nonsolvency</strong> phenomena<br />
observed in aqueous polymer solutions with methanol as the<br />
second solvent. These are typical cases <strong>of</strong> preferential adsorption<br />
by the direct site-binding. If H-bonding is cooperative, the composition<br />
<strong>of</strong> the bound water molecules along the polymer chain is<br />
not proportional to the composition in the bulk but shows a large<br />
deviation from linearity (nonlinear amplification). Also, a slight<br />
bias in the overall solvent composition from the stoichiometric<br />
<strong>one</strong> is largely amplified on the chain due to the interaction<br />
Figure 9. (a) Cloud point curves plotted against the methanol mole fraction. The polymer molecular weight is varied from curve to curve. Experimental<br />
data (symbols) are compared with the theoretical calculation (solid lines) on the basis <strong>of</strong> the cooperative H-bonding. (b) Cloud point depression ΔT min<br />
<strong>and</strong> the methanol mole fraction xmin plotted against the reciprocal <strong>of</strong> the polymer molecular weight. In the limit <strong>of</strong> high molecular weight, theoretical<br />
curve (solid line) largely deviate from the data (symbols) due to the DCP formation.<br />
2988 dx.doi.org/10.1021/ma102695n |Macromolecules 2011, 44, 2978–2989