Appendix B. Further statistics of all samples
Appendix B. Further statistics of all samples
Appendix B. Further statistics of all samples

Create successful ePaper yourself
Turn your PDF publications into a flip-book with our unique Google optimized e-Paper software.
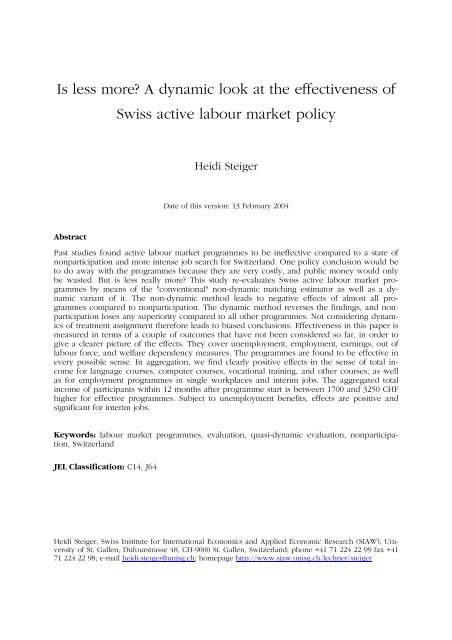
Is less more? A dynamic look at the effectiveness <strong>of</strong><br />
Abstract<br />
Swiss active labour market policy<br />
Heidi Steiger<br />
Date <strong>of</strong> this version: 13 February 2004<br />
Past studies found active labour market programmes to be ineffective compared to a state <strong>of</strong><br />
nonparticipation and more intense job search for Switzerland. One policy conclusion would be<br />
to do away with the programmes because they are very costly, and public money would only<br />
be wasted. But is less re<strong>all</strong>y more? This study re-evaluates Swiss active labour market programmes<br />
by means <strong>of</strong> the "conventional" non-dynamic matching estimator as well as a dynamic<br />
variant <strong>of</strong> it. The non-dynamic method leads to negative effects <strong>of</strong> almost <strong>all</strong> programmes<br />
compared to nonparticipation. The dynamic method reverses the findings, and nonparticipation<br />
loses any superiority compared to <strong>all</strong> other programmes. Not considering dynamics<br />
<strong>of</strong> treatment assignment therefore leads to biased conclusions. Effectiveness in this paper is<br />
measured in terms <strong>of</strong> a couple <strong>of</strong> outcomes that have not been considered so far, in order to<br />
give a clearer picture <strong>of</strong> the effects. They cover unemployment, employment, earnings, out <strong>of</strong><br />
labour force, and welfare dependency measures. The programmes are found to be effective in<br />
every possible sense. In aggregation, we find clearly positive effects in the sense <strong>of</strong> total income<br />
for language courses, computer courses, vocational training, and other courses, as well<br />
as for employment programmes in single workplaces and interim jobs. The aggregated total<br />
income <strong>of</strong> participants within 12 months after programme start is between 1700 and 3250 CHF<br />
higher for effective programmes. Subject to unemployment benefits, effects are positive and<br />
significant for interim jobs.<br />
Keywords: labour market programmes, evaluation, quasi-dynamic evaluation, nonparticipation,<br />
Switzerland<br />
JEL Classification: C14, J64<br />
Heidi Steiger, Swiss Institute for International Economics and Applied Economic Research (SIAW), University<br />
<strong>of</strong> St. G<strong>all</strong>en, Dufourstrasse 48, CH-9000 St. G<strong>all</strong>en, Switzerland; phone +41 71 224 22 99 fax +41<br />
71 224 22 98; e-mail heidi.steiger@unisg.ch; homepage http://www.siaw.unisg.ch/lechner/steiger
1 Introduction<br />
1<br />
This paper contributes to the evaluation <strong>of</strong> active labour market policies in Switzerland in two<br />
ways: first, programmes are re-evaluated with regard to a variety <strong>of</strong> outcomes such as unemployment,<br />
employment, earnings, out <strong>of</strong> labour force, and welfare dependency status. This<br />
provides a more complete insight <strong>of</strong> how labour market programmes affect participants. Secondly,<br />
for this purpose two different matching methods are used, one a non-dynamic estimator,<br />
the other a quasi-dynamic variant first suggested by Sianesi (2004). The results <strong>of</strong> the two<br />
methods are compared.<br />
Evaluation <strong>of</strong> active labour market programmes with respect to their "effectiveness" asks for a<br />
definition <strong>of</strong> the target variable, i.e. the context in which effectiveness is measured. Former<br />
work by Gerfin and Lechner (2002) and Lalive, van Ours and Zweimüller (2002) used the outcome<br />
"deregistered from unemployment" as efficiency measure. This paper doesn't want to<br />
restrict this term to either a single indicator or some composite welfare measure, but uses a<br />
variety <strong>of</strong> separate outcomes and analyzes them separately. For this purpose, a combination <strong>of</strong><br />
pension system and unemployment insurance records is used. This has partly been done in<br />
Gerfin, Lechner and Steiger (2002) already, but the focus <strong>of</strong> that study was different, and an indepth<br />
analysis was not the purpose <strong>of</strong> that study. Here, the data are used more efficiently to<br />
construct additional outcomes They provide an insight not only in how the employment status<br />
<strong>of</strong> participants evolves within and after their unemployment spells, but also gives earnings<br />
effects and indicators for dropping out <strong>of</strong> the labour force and/or welfare dependency. Therefore<br />
it gives a more complete picture <strong>of</strong> the effectiveness <strong>of</strong> different programmes than what is<br />
available until now.<br />
<strong>Further</strong>more, measuring effectiveness is always a comparison <strong>of</strong> different states. This paper has<br />
a micro perspective, i.e. the focus is on how a programme affects the participants compared to<br />
a state where they would not have participated in the corresponding treatment. Therefore, a<br />
natural comparison is a state "nonparticipation". For Gerfin and Lechner (2002) persons were<br />
defined as nonparticipants if they did not participate in any programme throughout their unemployment<br />
spell. Only nonparticipation and subsidised interim jobs by them were found to<br />
be superior programmes in terms <strong>of</strong> leaving unemployment and finding a job. Gerfin, Lechner<br />
and Steiger (2002) used updated data <strong>of</strong> the same sample to have a closer look at the different<br />
effects <strong>of</strong> different kinds <strong>of</strong> temporary subsidised employment in form <strong>of</strong> employment programmes<br />
and subsidised interim jobs; with better outcomes that also accounted for earnings<br />
effects they found that interim jobs to be superior for almost <strong>all</strong> possible subgroups; however,<br />
the superiority <strong>of</strong> nonparticipation compared to employment programmes was ch<strong>all</strong>enged<br />
though a clear picture could not be drawn. Lalive, van Ours and Zweimüller (2002) evaluated<br />
Swiss active labour market policies by means <strong>of</strong> a parametric duration model; nonparticipation<br />
was the base category and treated in a dynamic way. Almost <strong>all</strong> programmes were found to be
2<br />
effective, and employment programmes in particular turned out to be superior in <strong>all</strong> respects,<br />
more so for women.<br />
The research question posed here is how programmes affect the participants compared to<br />
nonparticipation. It is maybe the most interesting policy question in terms <strong>of</strong> active labour<br />
market programmes, because it directly asks if public spending is effective at <strong>all</strong>: <strong>all</strong> programmes<br />
are costly except for interim jobs which are less expensive than just passive maintenance.<br />
Therefore, efficient spending means that there is a return on active labour market programmes.<br />
This question was addressed in the earlier studies mentioned above also. However,<br />
recent work by Fredriksson and Johansson (2002) showed that both ways <strong>of</strong> treating nonparticipation<br />
give biased results. The method <strong>of</strong> Sianesi (2004) is an empirical strategy that is in<br />
line with these findings; she applied a quasi-dynamic approach to an evaluation <strong>of</strong> Swedish<br />
programmes that are very similarly set up as in Switzerland. It applies another definition <strong>of</strong><br />
nonparticipation altogether: every person is a nonparticipant until she participates in a programme<br />
or leaves unemployment. This method is adjusted here for the needs <strong>of</strong> evaluating<br />
Swiss programmes. Moreover, none <strong>of</strong> the previous studies re<strong>all</strong>y gave a comprehensive picture<br />
<strong>of</strong> the effects in terms <strong>of</strong> different outcomes.<br />
This paper is structured in the following way: section 2 gives an overview <strong>of</strong> active labour<br />
market policy in Switzerland. Section 3 explains the two estimation strategies, section 4 describes<br />
the data and how it is sampled for this study. Section 5 shows and discusses estimation<br />
results, and section 0 concludes.<br />
2 Active labour market policy in Switzerland<br />
2.1 Design<br />
Tradition<strong>all</strong>y, Switzerland has seen low unemployment, which facilitates high public spending<br />
on the unemployed. Besides comparatively high passive unemployment benefits (between 70<br />
and 80 percent <strong>of</strong> former salary), Switzerland maintains a comprehensive toolbox <strong>of</strong> active<br />
programmes also.<br />
Counselling and placement services are available to every job seeker in Switzerland, regardless<br />
<strong>of</strong> his or her unemployment status. Actual unemployed persons are entitled to more intensive<br />
programmes such as personality, computer, and language courses, or other vocational training,<br />
in order to re-fresh and improve their pr<strong>of</strong>essional abilities. For work experience different<br />
kinds <strong>of</strong> employment subsidies or specific<strong>all</strong>y designed temporary jobs are available. The duration<br />
<strong>of</strong> programmes varies substanti<strong>all</strong>y: full-time courses may not last longer than two months<br />
whereas employment programmes norm<strong>all</strong>y are assigned for 6 months.<br />
An unemployed person registers with the corresponding regional unemployment <strong>of</strong>fice. The<br />
responsible caseworker takes up the case and meets the unemployed on a regular basis to
3<br />
evaluate the endeavours for finding a job and to chart a roadmap to success. Caseworkers<br />
counsel the unemployed and decide about participation in active labour market programmes.<br />
Once decreed by the <strong>of</strong>ficer, a programme is compulsory: non-attendance by the unemployed<br />
is sanctioned by benefit cancellation.<br />
2.2 Nonparticipation<br />
Why do certain unemployed participate in a programme, but others do not? Nonparticipation<br />
in the Swiss setup arises, (1) if the unemployed has not been assigned to a programme by the<br />
caseworker, (2) if the unemployed has not come up with the idea <strong>of</strong> a programme himself, or<br />
(3) if the unemployed wanted to participate in a programme, but his request was not granted<br />
by the caseworker.<br />
ad (1): The policy for assignment <strong>of</strong> unemployed into programmes is not standardised in Switzerland;<br />
cantons have a considerable amount <strong>of</strong> autonomy in executing the federal law. Assignment<br />
<strong>of</strong> persons into programmes furthermore varies between employment <strong>of</strong>fices and<br />
<strong>of</strong>ficers themselves. A person might not be assigned to a programme by the caseworker because<br />
there is no programme available (limited supply), because the caseworker doesn't see<br />
any need for training, or because he wants to give the person more time to search for a job<br />
instead <strong>of</strong> keeping her busy with participation in a programme.<br />
ad (2) and (3): An unemployed person can apply herself for programmes. The request has to<br />
be granted by the caseworker or – in case <strong>of</strong> expensive programmes – by the cantonal authority.<br />
The programme by law has to increase the unemployed person's employability in order to<br />
be granted. Another programme that is mostly organised by the unemployed themselves is an<br />
interim job: a job is taken up interim in order to avoid joblessness, though the job is not "suitable"<br />
in the sense <strong>of</strong> the unemployment insurance act (more than 2 hours away from home,<br />
pays less than actual unemployment benefits, or has unacceptable working conditions for the<br />
person, e.g. work on c<strong>all</strong>).<br />
Participation furthermore is hardly related to a point <strong>of</strong> time within the total unemployment<br />
spell. There is no rule which says that after a certain point <strong>of</strong> time a person is obliged to participate<br />
in a specific programme or the opposite, i.e. participation is not possible any more.<br />
The federal authority gives a general recommendation to assign people into programmes early<br />
in their spell. However, this recommendation is not binding and <strong>of</strong>ten not followed.<br />
If a person has not participated in any programme, this therefore might be more a combination<br />
<strong>of</strong> dynamic decisions at every meeting with the caseworkers than a predefined and intentional<br />
strategy. Since meetings with caseworkers norm<strong>all</strong>y take place at least once in a month,<br />
a monthly decision basis is appropriate for evaluation purpose also.
3 Econometrics<br />
3.1 Identification and Estimation<br />
4<br />
The definition <strong>of</strong> an individual causal effect <strong>of</strong> a treatment 1 is the difference between what a<br />
person achieves when she got the treatment and what she would have achieved in the absence<br />
<strong>of</strong> it. The average effect then is the mean <strong>of</strong> <strong>all</strong> individual effects if macro effects are<br />
ruled out (stable unit treatment value assumption, SUTVA). By denoting the outcome (achieve-<br />
ment) as Y we thus can define two states for a person:<br />
the presence <strong>of</strong> a treatment. The average treatment effect then is<br />
1 0<br />
E ⎡<br />
⎣Y −Y<br />
⎤<br />
⎦.<br />
0<br />
Y is the state in the absence,<br />
1<br />
Y in<br />
In the presence <strong>of</strong> multiple (R) treatments the causal effect can be defined following Lechner<br />
(2001b) between any two programmes m and l as the effect <strong>of</strong> participating in one <strong>of</strong> the R<br />
programmes m compared to participation in any other programme l ≠ m. A natural effect <strong>of</strong><br />
interest would then be the comparison to nonparticipation:<br />
m 0<br />
E ⎡<br />
⎣Y −Y<br />
⎤<br />
⎦ .<br />
People now can be observed in only one programme (or in no programme), such that the<br />
specific outcome for them is known after actual programme participation. If we denote participation<br />
as D, we thus can observe<br />
m<br />
E ⎡<br />
⎣Y D = m ⎤<br />
⎦<br />
The possible outcome after another treatment or after not participating at <strong>all</strong> is unknown, since<br />
those people didn’t take place in any <strong>of</strong> them. They are referred to as counterfactuals, that is,<br />
hypothetical outcomes in a hypothetic<strong>all</strong>y existing par<strong>all</strong>el world.<br />
l<br />
E ⎣<br />
⎡Y D = 0⎤<br />
⎦ or<br />
⎡<br />
⎣<br />
⎤<br />
⎦<br />
0<br />
E Y D = l<br />
In the remaining part <strong>of</strong> this paper the focus will be on average treatment effects on the<br />
treated (ATT):<br />
⎣<br />
⎡ ⎤<br />
⎦<br />
⎡<br />
⎣<br />
⎤<br />
⎦<br />
⎡<br />
⎣<br />
⎤<br />
⎦<br />
m 0 m<br />
0<br />
E Y − Y D = m = E Y D = m − E Y D = m<br />
The outcomes <strong>of</strong> people who have not participated is<br />
⎡<br />
⎣ = 0⎤<br />
⎦ . What we observe thus is<br />
0<br />
E Y D<br />
⎡<br />
⎣ = ⎤<br />
⎦ − ⎡<br />
⎣ = 0⎤ ⎦ = ⎡<br />
⎣ − = ⎤<br />
⎦+ ⎡<br />
⎣ = ⎤<br />
⎦− ⎡<br />
⎣ = 0⎤<br />
������������� ⎦<br />
m 0 m 0 0 0<br />
E Y D m E Y D E Y Y D m E Y D m E Y D<br />
selection bias<br />
1 Active labour market programmes are referred to as “treatments” in this literature (following the biostatistical literature).
5<br />
The second part <strong>of</strong> this is the selection bias, i.e. the difference between their (hypothetical or<br />
actual) outcomes after nonparticipation. In non-experimental studies this bias is not expected<br />
to be zero; i.e. persons who actu<strong>all</strong>y participated in programme m might have a different expected<br />
outcome after nonparticipation than those who actu<strong>all</strong>y did not participate. In other<br />
words, people might have been selected into programmes according to their expected pr<strong>of</strong>its<br />
<strong>of</strong> the programme. Would this selection bias be zero, we just could take the average outcomes<br />
in both participant groups <strong>of</strong> programmes 0 and m, and it would be the causal effect. This is –<br />
under further assumptions – the case in experimental studies. However, experimental data are<br />
not at hand. For the identification <strong>of</strong> treatment effects from non-experimental data in principle<br />
two strategies are possible: the first strategy is to assume that <strong>all</strong> relevant information about the<br />
connection between programme selection and outcome is given. This is c<strong>all</strong>ed “selection on<br />
observables” or “conditional independence assumption” (CIA). If this assumption is not credible<br />
with the data at hand, other strategies based on “selection on unobservables” have to be<br />
applied (Instrument variable, difference-in-difference, distributional assumptions <strong>of</strong> selection<br />
bias components, etc.). For an overview <strong>of</strong> strategies see Heckman, LaLonde, Smith (1999).<br />
The CIA states that, given <strong>all</strong> known characteristics X that jointly influence participation decision<br />
and outcome after participation, the (hypothetical) outcome after participation in a programme<br />
is independent <strong>of</strong> the actual participation D:<br />
l<br />
Y � D X l ∈ { m,0}<br />
For the matching estimator we need a second assumption, namely that everybody has a positive<br />
probability to be in either programme m or programme 0:<br />
P( D = r ) > 0 r ∈ { m,0}<br />
With this assumption we can identify<br />
⎡<br />
⎣<br />
⎤<br />
⎦<br />
⎡<br />
⎣<br />
⎤<br />
⎦<br />
0 0<br />
E Y D = m, X = x = E Y D = 0, X = x<br />
Integrating over x we get:<br />
∫<br />
⎡<br />
⎣<br />
⎤<br />
⎦<br />
⎡<br />
⎣<br />
⎤<br />
⎦<br />
0 0<br />
E Y D = m = E Y D = 0, X = x f( x D = m) dx<br />
The average treatment effect <strong>of</strong> m on those who participated in m compared to those partici-<br />
m,0<br />
pating in 0 ( θ ) then is<br />
= E ⎣Y D = m⎦− E ⎣Y D = 0, X = x⎦f( x D = m) dx<br />
m,0 m<br />
0<br />
θ ⎡ ⎤ ⎡ ⎤<br />
∫<br />
m<br />
E ⎡<br />
⎣Y D = m ⎤<br />
⎦ is estimated by the sample mean outcome <strong>of</strong> <strong>all</strong> participants in treatment m.<br />
The second part is a little bit more difficult to estimate because X is multi-dimensional. It is<br />
shown that instead <strong>of</strong> the whole vector <strong>of</strong> X it is sufficient to condition on the participation<br />
probabilities P ( D = m X = x ) and P ( D 0 X x)<br />
= = (cf. Lechner 2001a). In this paper the
6<br />
conditioning is based on <strong>all</strong> participation probabilities as well as on other important variables<br />
(age, gender, duration <strong>of</strong> unemployment at beginning <strong>of</strong> programme, employability, mother<br />
tongue, qualification, canton), because the availability <strong>of</strong> additional programmes effects the<br />
choice <strong>of</strong> the actual programme. For every person in the sample <strong>of</strong> participants in treatment m<br />
one or several very similar persons in treatment 0 are found and the (weighted average) outcome<br />
is calculated. “Similarity” is in terms <strong>of</strong> the participation probabilities and the other variables<br />
also. The matching procedure can be based on one nearest neighbour only or on a<br />
weighted average <strong>of</strong> several similar persons. A comprehensive overview <strong>of</strong> matching estimators<br />
is given in Frölich (2004). In this application, nearest-neighbour-matching is done.<br />
3.2 Quasi-dynamic matching<br />
A non-dynamic variant <strong>of</strong> the matching method defines participants as those who participated<br />
in the programme once in their total spell, and nonparticipants as those who never participated<br />
in any programme. Fredriksson and Johansson (2002) showed that this leads to negative<br />
effects <strong>of</strong> treatments compared to nonparticipation, because the conditional independence<br />
assumption does not hold: The treatment indicator itself is defined based on future outcomes.<br />
Sianesi (2004) developed and applied an empirical approach to account for the dynamics <strong>of</strong><br />
the treatment decision: she treats nonparticipants as “waiters”. Nonparticipation is not treated<br />
as an own programme, but as a “default” state with more intensive job search. This approach<br />
resembles the hazard model with multiple risks: at any time after registration a person decides<br />
whether to participate in any programme m or to wait. All persons who haven’t participated<br />
until time t and who are still unemployed are “waiters”.<br />
The CIA that is required for this is<br />
�<br />
Y D X = x, D = D = ... = D = 0, still unemployed in τ, t > τ<br />
0 τ 1 2<br />
τ<br />
t<br />
This CIA states that how the (hypothetical) outcome evolves after not participating up to time<br />
τ is independent <strong>of</strong> a programme participation at time τ, given characteristics X.<br />
The treatment effect <strong>of</strong> having participated in programme m at time τ instead <strong>of</strong> waiting at<br />
least one period longer, for those who participated, is (note that the outcome is measured at<br />
different points <strong>of</strong> times t after programme participation):<br />
⎡ ⎤<br />
⎣ ⎦<br />
m, τ m,<br />
τ 0, τ τ<br />
θt = EYt − Yt D = m t > τ<br />
The composite treatment effect at time t for <strong>all</strong> persons having participated at any time before t<br />
compared to having waited therefore is:<br />
= ∑<br />
τ<<br />
τ<br />
⋅<br />
τ<br />
= =<br />
,<br />
m<br />
t<br />
t<br />
m<br />
t<br />
θ θ<br />
( )<br />
P D m D m<br />
Note that meaning <strong>of</strong> “causality” in this context is not straightforward. m<br />
θ is the over<strong>all</strong> treatment<br />
effect on those who participated in programme m at any time in their unemployment
7<br />
spell instead <strong>of</strong> waiting longer, which might include another programme participation later in<br />
their spell as well.<br />
3.3 Matching procedure<br />
Conventional nearest-neighbour-matching in a multiple treatment setup according to Gerfin<br />
and Lechner (2002) as well as an adjusted version for the Sianesi (2004) approach are used.<br />
The following subsections explain the steps.<br />
1. Propensity scores<br />
The suggested multinomial probit model for calculating the propensity scores is computation<strong>all</strong>y<br />
very expensive in the case <strong>of</strong> 10 treatments. Therefore 9 binomial probits based on <strong>all</strong><br />
observations are used here (dependent variable: “participant in treatment j”). Lechner (2002)<br />
found that this procedure leads to results very close to those obtained using the multinomial<br />
probit estimates.<br />
On the basis <strong>of</strong> the computed coefficients, for every person and every programme their re-<br />
0 9<br />
spective participation probabilities are computed ( P ,... P ).<br />
i i<br />
For the quasi-dynamic approach the same participation probabilities are computed. 2<br />
2. Common support<br />
The Common support restriction follows directly Gerfin and Lechner (2002). More work on<br />
common support and how it effects estimates is provided in Lechner (2001a). It eliminates <strong>all</strong><br />
observations that have propensity scores sm<strong>all</strong>er than the maximum <strong>of</strong> <strong>all</strong> minima or bigger<br />
than the minimum <strong>of</strong> <strong>all</strong> maxima within the treatment groups. This criterion guarantees comparability<br />
between treatment groups.<br />
In the quasi-dynamic approach the common support restriction is not applied, because regularly<br />
there are very few participants in every month, and a quite large set <strong>of</strong> corresponding<br />
nonparticipants.<br />
3. Matching procedure<br />
The matching procedure is nearest-neighbour matching with replacement, as used in GL:<br />
Within a treatment group m for every observation (person) i the most similar person j from the<br />
treatment group 0 is chosen. “Similarity” is defined in terms <strong>of</strong> the Mahalanobis distance based<br />
0<br />
on <strong>all</strong> propensity scores P – 9<br />
P as well as a subset <strong>of</strong> outcome specific covariates x� i : beginning<br />
<strong>of</strong> programme, age, gender, duration <strong>of</strong> unemployment at beginning <strong>of</strong> programme, em-<br />
2 A propensity score for participation at the corresponding time τ cannot be used because there are too few single<br />
observations in the corresponding cells starting a programme.
8<br />
ployability, mother tongue, qualification, canton. The person with the minimum Mahalanobis<br />
distance to person i from the pool <strong>of</strong> participants in treatment 0 is defined as her “counterfac-<br />
tual”. A person in 0 might be the closest match for more than one observation in m.<br />
counts the numbers <strong>of</strong> times a person in the pool l is used as the closest match for a person in<br />
pool m. The counterfactual outcome for a person is computed as:<br />
1<br />
Y = w ⋅Y<br />
∑<br />
cf m, l<br />
i<br />
N m j∈Il j j<br />
The treatment effect is computed as:<br />
ml , 1<br />
cf<br />
θ = ∑ ( Yi −Yi<br />
)<br />
N m i∈Im Simple standard errors <strong>of</strong> the ATT ignoring the variance <strong>of</strong> the first estimation step (propensity<br />
scores) are computed following Lechner (2001b) as the square root <strong>of</strong><br />
1 � 1 ml ,2<br />
Var Y + �<br />
2 ∑ w j ⋅Var<br />
Y ,<br />
N i∈Im N<br />
j∈Il m m<br />
j∈Il l is always used for the ‘untreated’ and m for the ‘treated’.<br />
This matching procedure in principle is independent <strong>of</strong> the outcome measured. However, in<br />
this framework there is a problem with the outcomes 2, 3, and 4: both <strong>of</strong> them are measured<br />
in months after programme start. For persons with an early programme start date, e.g. January<br />
1998, this outcome is observed for a very long time. For persons with a late programme start<br />
only a short time interval after programme start is observed, and later outcomes are missing.<br />
The same problem arises for persons whose benefit entitlement period started late (for outcome<br />
3) or whose registration was late (outcome 4). The following solution is chosen: Persons<br />
here are matched only once. For later time periods, the counterfactual outcome exists only if<br />
the counterfactual person also still has an outcome. The variance takes into account only the<br />
observations with positive weights.<br />
The quasi-dynamic matching estimator m<br />
θ is the following:<br />
t −<br />
�m � m,<br />
τ τ<br />
θ = θ ⋅ ˆ<br />
t t P ( D = m D = m, τ < t )<br />
∑<br />
τ =<br />
1<br />
1<br />
N N<br />
τ τ<br />
with Pˆ ( D = m D = m, τ < t) = ∑1 ( D = m, τ < t) / ∑1<br />
( D = m, τ < t )<br />
i= 1 i=<br />
1<br />
where �, m τ<br />
θ is the conventional matching estimator for the treatment effect on the treated <strong>of</strong><br />
t<br />
starting a programme m at time τ compared to not starting a programme until and by the end<br />
<strong>of</strong> month τ, as described above. The aggregate effect sums up over <strong>all</strong> persons having already<br />
started their programme before t. ˆ ( τ = , τ < )<br />
m starting their treatment at time τ <strong>of</strong> <strong>all</strong> those starting before t.<br />
The variance is computed the same way:<br />
ml<br />
w j<br />
P D m t is the share <strong>of</strong> participants in programme
−<br />
� � τ τ<br />
( θ ) = ∑ θ ⋅ ( = = τ < )<br />
1 t<br />
m m,<br />
Var ˆ<br />
t Var t P D m D m, t<br />
4. Validity <strong>of</strong> CIA<br />
τ = 1<br />
9<br />
CIA is a very strong assumption that states that <strong>all</strong> information that influences the participation<br />
decision and the outcome at the same time are observed and controlled for. Nullity would<br />
mean that there are unobservable differences between the treated and untreated group that are<br />
not controlled for but that jointly influence participation and outcome. In that case the effects<br />
don’t have any causal interpretation, but are a composite between the selection bias and the<br />
true causal effect. In the non-dynamic setup the CIA has proved to be violated. For the quasidynamic<br />
setup, scepticism about the validity <strong>of</strong> the CIA might come up. Nevertheless, we refer<br />
readers to the comprehensive data that among other variables also contains earnings pr<strong>of</strong>iles<br />
<strong>of</strong> the past 10 years as well as caseworkers’ subjective rating <strong>of</strong> the unemployed person’s employability.<br />
With these variables a lot <strong>of</strong> gener<strong>all</strong>y unobserved but important heterogeneity<br />
should be accounted for.<br />
4 Data and Sampling<br />
4.1 Data<br />
The sample contains a cross section <strong>of</strong> <strong>all</strong> people who were unemployed at the end <strong>of</strong> December<br />
1997. 3 The data is a combination <strong>of</strong> two information systems <strong>of</strong> the unemployment<br />
insurance (placement/<strong>statistics</strong> and payments) and pension system records. The different data<br />
sets can be combined through a unique personal identification number.<br />
The following information is available in the data:<br />
Placement and labour market <strong>statistics</strong> database: Monthly information about corresponding<br />
placement <strong>of</strong>fice, personal characteristics, characteristics <strong>of</strong> previous job and desired job, status<br />
<strong>of</strong> job seeking, work experience, skills and caseworker’s rating <strong>of</strong> chances to find a job, duration<br />
<strong>of</strong> unemployment spell, participation in active labour market programmes/job introduction<br />
<strong>all</strong>owances. 4 We use pre-programme information from December 1997 as well as monthly information<br />
for the definition <strong>of</strong> unemployment status from January 1998 to December 1999.<br />
Payment system: Total benefits and other supplementary <strong>all</strong>owances paid by the unemployment<br />
insurance, sanctions, interim jobs, benefit exhaustion (on a monthly basis). We use pre-<br />
3 The data is an update and extension <strong>of</strong> the one used by Gerfin and Lechner (2002). More information about the<br />
original sample is given there.<br />
4 Though the data is very rich and contains a lot <strong>of</strong> information, it has to be mentioned that information about education<br />
is not available for the time covered here.
10<br />
programme information from December 1997 as well as monthly information for the definition<br />
<strong>of</strong> interim jobs and unemployment status from January 1998 to December 1999.<br />
Pension system: All payments paid to the pension system by an employer, by the person for<br />
self or by the unemployment insurance (the source can be identified); data gives yearly information<br />
indicating months <strong>of</strong> begin and end <strong>of</strong> each income spell (maximum January and December).<br />
This data is available from 1988 to 1999 for this study. Data from 1988 to 1997 is<br />
used for the construction <strong>of</strong> unemployment and employment history, data from 1996-1999<br />
addition<strong>all</strong>y is used for identification <strong>of</strong> employment on a monthly basis.<br />
For privacy protection rules access to <strong>all</strong> <strong>of</strong> these data bases is rigorously restricted. They are<br />
not publicly available.<br />
The pension system data were available for a subset <strong>of</strong> 81'399 persons. After applying diverse<br />
selection criteria (see <strong>Appendix</strong> A for the exact selection criteria) and applying the minimum<br />
duration criterion <strong>of</strong> 15 days for a programme 33'700 people remain.<br />
4.2 Outcomes<br />
This paper uses 11 different outcomes and three time frames in which outcomes are measured.<br />
The outcomes a-f are computed using raw pension system data only; outcome g-k use pension<br />
system data combined with unemployment insurance data.<br />
Outcome a: A person has a positive entry <strong>of</strong> a salary in the pension system for the corresponding<br />
month.<br />
Outcome b: A person has a positive entry <strong>of</strong> an unemployment benefits payment in the pension<br />
system for the corresponding month.<br />
Outcome c: A person has no entry in the pension system for the corresponding month.<br />
Outcome d: "Raw" income from employment in corresponding month according to the pension<br />
system.<br />
Outcome e: "Raw" income from unemployment in corresponding month according to the pension<br />
system.<br />
Outcome f: Total income from unemployment in corresponding month according to the pension<br />
system.<br />
Outcome g: A person is employed according to the pension system data in an employment<br />
spell that lasts at least three consecutive months; at the same time that person doesn’t receive<br />
any payments from the unemployment insurance.<br />
Outcome h: A person is employed according to the same criteria as in outcome g (at least 3<br />
consecutive months, no benefits at the same time); addition<strong>all</strong>y, the earnings are at least 90<br />
percent <strong>of</strong> the last income which is the basis for the computation <strong>of</strong> benefits.<br />
Outcome i: Earnings in employment according to the definition in outcome g (at least 3 consecutive<br />
months, no benefits at the same time), this variable is 0 if outcome g is 0.
11<br />
Outcome j: A person is employed according to the same criteria as in outcome g (at least 3<br />
consecutive months, no benefits at the same time); addition<strong>all</strong>y, the earnings are “sustainable”<br />
in the sense that they exceed a minimal income criteria that is computed according to the<br />
guidelines <strong>of</strong> the social welfare (basic needs, additional needs, health insurance, flat rent) on<br />
the basis <strong>of</strong> the number <strong>of</strong> persons in the same household and the area the person lives.<br />
Outcome k: A person is registered at the regional employment <strong>of</strong>fice. This variable is set to 0 if<br />
the person at the same time has an ongoing earnings spell with earnings <strong>of</strong> at least 3000<br />
francs.<br />
Outcomes are measured in three different time frames:<br />
1. After programme start: maximum 23 months after programme start<br />
The first 6 outcomes (a-f) are measured in two more time frames:<br />
2. Entitlement period: months <strong>of</strong> entitlement period (maximum 48 months).<br />
3. Registration period: months since last registration (before beginning <strong>of</strong> 1998) in unemployment<br />
(maximum 36 months).<br />
Time frame 2 and 3 are not the same. The entitlement period starts with an unemployment<br />
spell. If the person re-registers unemployed after a short period <strong>of</strong> unemployment, the old<br />
entitlement period is still going on.<br />
For the time frames 2 and 3 only outcomes purely based on the pension system (i.e. a-f) exist<br />
because monthly data from the other systems is not complete for the time period January 1996<br />
– December 1997. Therefore, in total 23 outcomes are defined, each <strong>of</strong> them for the available<br />
time periods.<br />
4.3 Programmes<br />
In line with earlier evaluation work for Switzerland, the first significant programme after<br />
1.1.1998 is considered, i.e. the first programme that exceeds two weeks. Shorter programmes<br />
are not taken into account.<br />
The programme code in the unemployment insurance data differentiates between more than<br />
30 programmes. Here they are aggregated to 8 programme groups; this aggregation is similar<br />
to the one used by Frölich, Lechner and Steiger (2003): personality and other basic courses (1),<br />
language courses (2), basic computer courses (3), higher vocational training (4), lower vocational<br />
training (5), other training (6), employment programmes in single workplaces (7), employment<br />
programmes in collective workplaces (8). Basic programmes are not taken into account<br />
at <strong>all</strong> because they are <strong>of</strong>ten followed by another programme and the effects should be<br />
assigned to the predominant programme. A 9 th programme is defined according to the unemployment<br />
insurance payment data if the computed length exceeds 2 weeks: interim jobs (9).
12<br />
1 Personality and other basic courses: They are courses who help persons to position themselves<br />
and their needs in the labour market. Addition<strong>all</strong>y, there are courses for basic qualifications.<br />
2 Language courses: They can be either courses in a foreign language for persons with good<br />
knowledge in the corresponding Swiss language, or German/French courses for persons with<br />
another mother tongue.<br />
3 Basic computer course: This computer course gives basic knowledge, e.g. Word courses,<br />
beginners courses, internet courses, etc.<br />
4 Higher vocational training: These courses are on a higher level than an actual vocational<br />
education in Switzerland; they include computer courses on an advanced level for specialists,<br />
commercial, and technical courses.<br />
5 Lower vocational training: These courses are not beyond the level <strong>of</strong> a vocational education.<br />
They include commercial, technical, hotel/restaurant industry, nursing, and cleaning courses.<br />
6 Other training: This is a group that subsumes <strong>all</strong> other courses: laboratory firms, internship,<br />
self-employment courses.<br />
7 Employment programmes single workplace: Participants work in the public administration, in<br />
another public service, or in a non-pr<strong>of</strong>it organisation. They work together with other “norm<strong>all</strong>y”<br />
employed persons.<br />
8 Employment programmes collective workplace: Participants work in facilities speci<strong>all</strong>y designed<br />
for unemployed persons, e.g. recycling.<br />
9 Interim jobs: A job in the labour market that is not suitable for the unemployed but that<br />
he/she takes up temporarily to avoid joblessness. It is subsidised by the unemployment insurance<br />
such that the unemployed is better <strong>of</strong>f than with unemployment benefits only. This programme<br />
is observable only month-wise; here participation is defined as having received the<br />
subsidy for at least 2 weeks. 5<br />
4.4 Definition <strong>of</strong> nonparticipants and programme start dates<br />
Nonparticipants in the non-dynamic matching part are defined according to Gerfin and<br />
Lechner (2002) as persons who don't participate in any programme in the observable time<br />
frame. For the outcome after programme start a hypothetical programme start date is assigned<br />
to persons in the following way: the programme start variable for <strong>all</strong> other persons is regressed<br />
on <strong>all</strong> available X variables. Based on the estimated coefficients and the corresponding X characteristics<br />
<strong>of</strong> the nonparticipants hypothetical starts for nonparticipants are computed. Nonparticipants<br />
who are already employed or don't have any entry in their pension system records<br />
are excluded from the sample.
13<br />
For the quasi-dynamic method nonparticipation is defined on a monthly basis: a person in<br />
month t is a nonparticipant if she has not yet participated in a programme and at the same<br />
time is not employed or out <strong>of</strong> labour force yet.<br />
In both cases a person f<strong>all</strong>s out <strong>of</strong> the comparison sample if she has already participated in a<br />
programme, if she is employed according to a criterion combining pension system records and<br />
unemployment insurance data, or if she doesn't have any information in her pension system<br />
records, which is an indicator <strong>of</strong> being out <strong>of</strong> labour force or welfare dependent. In both cases<br />
a person in a strict sense is not part <strong>of</strong> the target group <strong>of</strong> a programme any more and hence<br />
is excluded.<br />
4.5 Descriptive <strong>statistics</strong><br />
Some selected descriptive <strong>statistics</strong> <strong>of</strong> the whole sample are given in Table 4-1. An overview <strong>of</strong><br />
<strong>all</strong> descriptive <strong>statistics</strong> <strong>of</strong> <strong>all</strong> variables available is given in <strong>Appendix</strong> B.<br />
Table 4-1 Selected descriptive <strong>statistics</strong><br />
Sample A Sample B<br />
Current unemployment spell<br />
Duration <strong>of</strong> current unemployment, 31.12.1997 151.03 147.12<br />
Unemployment benefit, daily, CHF 139.09 137.63<br />
Programme participation (in %)<br />
No course 0.32 0.47<br />
Personality course 0.05 0.04<br />
Language course 0.09 0.08<br />
Basic computer course 0.08 0.06<br />
Vocational training high level 0.02 0.02<br />
Vocational training low level 0.03 0.02<br />
Other training 0.02 0.01<br />
Employment programme public 0.07 0.05<br />
Employment programme private 0.07 0.05<br />
Temporary wage subsidy 0.25 0.20<br />
Duration <strong>of</strong> current unemployment spell at begin <strong>of</strong> first programme<br />
Other socio-economic characteristics<br />
94.66 206.26<br />
Female 0.44 0.46<br />
Marital status single 0.28 0.26<br />
Marital status married 0.59 0.61<br />
Nationality Swiss 0.56 0.54<br />
Foreigner with permanent permit 0.29 0.30<br />
Qualification: skilled 0.57 0.54<br />
Qualification: unskilled 0.27 0.31<br />
Mother tongue German 0.35 0.34<br />
Monthly earnings in last job in CHF 3883 3840<br />
Employability easy or very easy 0.20 0.21<br />
Employability medium<br />
Employment history from pension system data<br />
0.58 0.55<br />
Number <strong>of</strong> months unemployed since entry into pension system or since 1988 10.21 10.48<br />
Number <strong>of</strong> months employed since entry into pension system or since 1988 87.10 85.74<br />
5 For a comprehensive description <strong>of</strong> temporary interim jobs the reader is referred to Gerfin, Lechner and Steiger<br />
(2002).
Never unemployed 0.08 0.08<br />
Month <strong>of</strong> entry into pension system (1=January 1988) 13.49 14.13<br />
Number <strong>of</strong> unemployment spells since 1988 1.80 1.87<br />
Mean duration <strong>of</strong> unemployment spell in months 5.18 5.17<br />
Duration <strong>of</strong> last employment spell 52.60 50.23<br />
Graph 4-1 Descriptive <strong>statistics</strong> <strong>of</strong> outcomes<br />
Calendar time<br />
After programme start<br />
In benefit entitlement period<br />
Since registration<br />
%<br />
20 40 60 80 100<br />
%<br />
20 40 60 80 100<br />
%<br />
20 40 60 80 100<br />
%<br />
20 40 60 80 100<br />
14<br />
Outcomes in CHF Outcomes in %<br />
2 5 8 11 14 17 20 23<br />
calendar time in months (1 = Jan 98)<br />
Empl. >= 3 months<br />
Empl. w/o earnings loss<br />
Empl. with sust. earnings<br />
Searching for job<br />
Pension: empl>0<br />
Pension: unempl>0<br />
No info in AHV<br />
2 5 8 11 14 17 20 22<br />
months after programme start<br />
Empl. >= 3 months<br />
Empl. w/o earnings loss<br />
Empl. with sust. earnings<br />
Searching for job<br />
Pension: empl>0<br />
Pension: unempl>0<br />
No info in AHV<br />
2 5 8 11 14 17 20 23 26 29 32 35 38 41 44 47<br />
months in benefit entitlement period<br />
Pension: empl>0<br />
Pension: unempl>0<br />
No info in AHV<br />
2 5 8 11 14 17 20 23 26 29 32 35<br />
months since registration<br />
Pension: empl>0<br />
Pension: unempl>0<br />
No info in AHV<br />
CHF<br />
0 1000 2000 3000 4000<br />
CHF<br />
0 1000 2000 3000 4000<br />
CHF<br />
0 1000 2000 3000 4000<br />
CHF<br />
0 1000 2000 3000 4000<br />
2 5 8 11 14 17 20 23<br />
calendar time in months (1 = Jan 98)<br />
Earnings in empl. >=3 m<br />
Income from empl.<br />
Income from unempl.<br />
Total income<br />
2 5 8 11 14 17 20 22<br />
months after programme start<br />
Earnings in empl. >=3 m<br />
Income from empl.<br />
Income from unempl.<br />
Total income<br />
2 5 8 11 14 17 20 23 26 29 32 35 38 41 44 47<br />
months in benefit entitlement period<br />
Income from empl.<br />
Income from unempl.<br />
Total income<br />
2 5 8 11 14 17 20 23 26 29 32 35<br />
months since registration<br />
Income from empl.<br />
Income from unempl.<br />
Total income<br />
Note: All graphs are based on Sample A with 21'555 observations (after common support restriction and dropping out<br />
nonparticipants based on their assigned starting date).
15<br />
Graphs with descriptive <strong>statistics</strong> <strong>of</strong> outcomes are displayed in Graph 4-1. At the beginning <strong>of</strong><br />
1998, nobody is employed and <strong>all</strong> persons are searching for a job according to the unemployment<br />
insurance data. The pension system records show that still persons receive income from<br />
employment, which most probably comes from interim jobs or employment programmes. The<br />
amount <strong>of</strong> persons without information in the pension system increases by time. Typic<strong>all</strong>y, the<br />
share <strong>of</strong> persons without information jumps up after the benefit entitlement period is exhausted<br />
(after 24 months). Similarly, the total available income drops after benefit exhaustion.<br />
Surprisingly, at a first glance no employment effect close to benefit exhaustion can be found.<br />
The share <strong>of</strong> persons with a "stable" or "sustainable" job increases with time. Towards the end<br />
<strong>of</strong> the observation period, the income mainly comes from stable income <strong>of</strong> at least 3 months.<br />
5 Results<br />
5.1 Propensity Scores<br />
The computation <strong>of</strong> propensity scores should contain <strong>all</strong> variables X that potenti<strong>all</strong>y influence<br />
both the participation decision and the later outcome. In principle <strong>all</strong> available variables are<br />
used for estimation; variables not used are either collinear to other variables, or they predict a<br />
participation decision perfectly. As already described, 10 binomial probit models are estimated<br />
for the dynamic and the non-dynamic models. The coefficients are not <strong>of</strong> particular interest<br />
and therefore not given here.<br />
5.2 Common Support<br />
The common support criterion described above sh<strong>all</strong> guarantee comparability <strong>of</strong> the people in<br />
the treatment groups by excluding observations that are not comparable to observations in<br />
other programme participant groups. For this purpose, <strong>all</strong> those with a propensity score<br />
sm<strong>all</strong>er than the maximum <strong>of</strong> <strong>all</strong> minima <strong>of</strong> propensity scores within the 10 participant groups<br />
are deleted as well as those with a propensity score bigger than the minimum <strong>of</strong> <strong>all</strong> maxima.<br />
This restriction guarantees comparability between <strong>all</strong> groups, i.e. <strong>all</strong> pairwise comparisons are<br />
based on the same observations. This leads to a significant loss <strong>of</strong> observations (cf. Table 5-1)<br />
<strong>of</strong> around 18 percent. Participants in language courses, employment programmes in collective<br />
workplaces, and interim jobs lose more observations than the average. That means that the<br />
participants in these programmes are less comparable to others. They might be more specific<strong>all</strong>y<br />
selected into these programmes.<br />
This selection possibly alters the underlying sample considerably. Tests for equality <strong>of</strong> means<br />
show that there are significant differences. Table 5-2 shows the number <strong>of</strong> outcome means that<br />
are significantly different before and after common support. In the time frame "calendar time"
16<br />
we can hardly find any differences. In the time frame "entitlement period" there are differences,<br />
especi<strong>all</strong>y in the two groups <strong>of</strong> vocational training. These groups however are sm<strong>all</strong>,<br />
and the difference might come especi<strong>all</strong>y from higher time periods were numbers <strong>of</strong> observations<br />
are very low.<br />
The common support in terms <strong>of</strong> propensity scores is displayed in Graph 5-1 in the form <strong>of</strong><br />
Kernel densities for the probability <strong>of</strong> not participating, within the subgroups, respectively. The<br />
support is reasonable equal among groups. Comparability between groups might be reasonably<br />
good.<br />
Table 5-1: Observations deleted due to common support criterion<br />
Before After (%)<br />
Total observations 26'333 21'555 18<br />
No programme 8'331 6'936 17<br />
Personality or other basic course 1'293 1'076 17<br />
Language course 2'704 2'007 26<br />
Basic computer course 1'891 1'647 13<br />
Higher vocational training 609 519 15<br />
Lower vocational training 707 607 14<br />
Other training 376 334 11<br />
Employment programme single workplace 1'764 1'496 15<br />
Employment programme collective workplace 1'826 1'486 19<br />
Interim job 6'832 5'447 20<br />
Note: (%) denotes the percentage <strong>of</strong> observations lost.<br />
Table 5-2: Test for equality <strong>of</strong> outcome means before and after common support<br />
Outcome a b c d e f g h i j k<br />
No programme 0 0 0 0 1 1 0 0 0 0 0 0 1 1 1 1 1<br />
Personality course 0 1 0 1 0 1 0 1 0 1 0 1 0 1 0 1 0<br />
Language course 0 1 0 1 0 2 0 1 0 1 0 1 0 0 0 1 0<br />
Computer course 0 2 0 1 0 2 0 1 0 1 0 1 0 0 0 1 0<br />
Higher voc. training 0 4 0 6 0 4 0 1 0 6 0 1 0 0 0 0 1<br />
Lower voc. training 0 3 0 9 0 3 0 3 0 9 0 3 0 2 0 2 1<br />
Other training 0 4 0 3 0 4 0 1 0 3 0 1 0 1 0 0 0<br />
Empl. pr. single 0 1 0 1 0 4 0 1 0 1 0 1 0 0 0 0 0<br />
Empl. pr. collective 0 2 0 2 0 2 0 1 0 1 0 1 0 0 0 0 0<br />
Interim job 0 0 0 0 0 0 0 0 0 0 0 0 0 0 0 0 0<br />
Note: For definitions <strong>of</strong> outcomes see above (4.2). Outcomes a-f are measured in calendar time since 1/1998 as well as in<br />
benefit entitlement period (maximal 48 periods). Outcomes g-k are measured in calendar time since 1/1998 (24<br />
months).<br />
Tests for comparing means before and after common support: ( ybefore − yafter ) /<br />
ber <strong>of</strong> significantly different means out <strong>of</strong> <strong>all</strong> time periods (23/48) are given.<br />
Var � / �<br />
before Nbefore+ Varafter/ Nafter<br />
>1.96; num
Graph 5-1 Kernel densities <strong>of</strong> propensity scores after common support restriction<br />
0 1 2 3 4 5<br />
17<br />
0 .2 .4 .6 .8<br />
no prog<br />
personality<br />
language<br />
computer<br />
voc. high<br />
voc. low<br />
other<br />
EP single<br />
EP coll.<br />
interim job<br />
Note: Kernel densities for Pr(no programme). The underlying sample is the final sample for the non-dynamic matching<br />
estimator, after dropping nonparticipants on the basis <strong>of</strong> computed programme start dates and after common support<br />
restriction, 21'555 observations (no programme: 8'331; personality: 1'293; language: 2'704; computer: 1'891; voc.<br />
high: 609; voc. low: 707; other training: 376; empl. prog. single: 1'764; empl. prog. collective: 1'826; interim job:<br />
6'832).<br />
5.3 Matching results<br />
In the following subsections the results <strong>of</strong> the different outcomes are discussed separately.<br />
Every section gives results from the non-dynamic as well as the quasi-dynamic setup. Every<br />
displayed point shows a significant average treatment effect on the treated (ATT, significance<br />
level 5 percent). For both setups, ATTs are given compared to nonparticipation (treatment<br />
effect on the participants compared to nonparticipation). "Nonparticipation" is defined by the<br />
corresponding non-dynamic and quasi-dynamic approaches, respectively. A point below 0<br />
means that for people having participated in the corresponding employment programme the<br />
outcome was lower than without any programme.<br />
The graphs display average treatment effects on the treated (ATT) for different treatments,<br />
points <strong>of</strong> times, and outcomes. Every point shows an ATT that is significant on the 5 percent<br />
level. Points above the 0 line mean that the reference treatment lead to a significantly higher<br />
outcome compared to the treatment defined by the symbol at the corresponding point <strong>of</strong> time,<br />
for the people having participated in the treatment the point is assigned to.
5.3.1 Employment and income based only on pension system data<br />
Table 5-3 Results for outcome "Employment based only on pension system data"<br />
%<br />
-30 -20 -10 0 10 20 30<br />
%<br />
-30 -20 -10 0 10 20 30<br />
%<br />
-30 -20 -10 0 10 20 30<br />
18<br />
Non-dynamic Quasi-dynamic<br />
After programme start<br />
2 5 8 11 14 17 20 22<br />
months after programme start<br />
2 5 8 11 14 17 20 23 26 29 32 35 38 40<br />
months in benefit entitlement period<br />
2 5 8 11 14 17 20 23 26 29 32<br />
months since registration<br />
%<br />
-40 -20 0 20 40<br />
2 5 8 11 14 17 20 23<br />
months after programme start<br />
In benefit entitlement period<br />
%<br />
-40 -20 0 20 40<br />
2 5 8 11 14 17 20 23 26 29 32 35 38 40<br />
months in benefit entitlement period<br />
Since registration<br />
%<br />
-40 -20 0 20 40<br />
2 5 8 11 14 17 20 23 26 29 32<br />
months since registration<br />
The first as well as the following outcomes are based purely on pension system data. A person<br />
is "employed" if she has a positive income that comes from a regular employer according to<br />
the data. A person is also "employed" by this definition when she is in an interim job or an<br />
employment programme, based on the way these earnings are defined. This is the reason for<br />
the positive effects after programme start (see Table 5-3): an employment programme regularly<br />
has a duration <strong>of</strong> around 6 months; this effect drops after 6 months for these programmes<br />
which means that this effect is "causal" only in the sense that these persons are in the programme<br />
whereas others are not. In general, programmes don't have negative effects in the<br />
quasi-dynamic framework compared to nonparticipation. In general, the effects are reversed.<br />
The earnings related to this employment are shown in Table 5-4. They mirror the employment<br />
effects displayed above.
Table 5-4 Results for outcome "Income from employment according to pension system"<br />
CHF<br />
-800-400 0 400 800<br />
CHF<br />
-800-400 0 400800<br />
CHF<br />
-800 -400 0 400 800<br />
19<br />
Non-dynamic Quasi-dynamic<br />
After programme start<br />
2 5 8 11 14 17 20 22<br />
months after programme start<br />
2 5 8 11 14 17 20 23 26 29 32 35 38 40<br />
months in benefit entitlement period<br />
2 5 8 11 14 17 20 23 26 29 32<br />
months since registration<br />
CHF<br />
-800 -400 0 400 800<br />
2 5 8 11 14 17 20 23<br />
months after programme start<br />
In benefit entitlement period<br />
CHF<br />
-800 -400 0 400 800<br />
2 5 8 11 14 17 20 23 26 29 32 35 38 40<br />
months in benefit entitlement period<br />
Since registration<br />
CHF<br />
-800-400 0 400800<br />
2 5 8 11 14 17 20 23 26 29 32<br />
months since registration<br />
5.3.2 Unemployment and income from unemployment based only on pension system<br />
data<br />
Income from unemployment in the definition here is benefit payments by the unemployment<br />
insurance, without earnings from employment programmes. For interim jobs the subsidy is<br />
counted as benefits, the employer's part itself not. In terms <strong>of</strong> unemployment a similar picture<br />
arises as for employment. A specific finding here is that after expiration <strong>of</strong> the <strong>of</strong>ficial benefit<br />
entitlement period (24 months) persons with interim jobs are more likely to receive unemployment<br />
benefits than others. Earnings in interim jobs <strong>all</strong>ow for extension <strong>of</strong> the benefit entitlement<br />
period whereas other programmes do not.
Table 5-5 Results for outcome "Employment based only on pension system data "<br />
%<br />
-30 -20 -10 0 10 20 30<br />
%<br />
-30 -20 -10 0 10 20 30<br />
%<br />
-30 -20 -10 0 10 20 30<br />
20<br />
Non-dynamic Quasi-dynamic<br />
After programme start<br />
2 5 8 11 14 17 20 22<br />
months after programme start<br />
2 5 8 11 14 17 20 23 26 29 32 35 38 40<br />
months in benefit entitlement period<br />
2 5 8 11 14 17 20 23 26 29 32<br />
months since registration<br />
%<br />
-40 -20 0 20 40<br />
2 5 8 11 14 17 20 23<br />
months after programme start<br />
In benefit entitlement period<br />
%<br />
-40 -20 0 20 40<br />
2 5 8 11 14 17 20 23 26 29 32 35 38 40<br />
months in benefit entitlement period<br />
Since registration<br />
%<br />
-40 -20 0 20 40<br />
2 5 8 11 14 17 20 23 26 29 32<br />
months since registration
21<br />
Table 5-6 Results for outcome "Income from unemployment according to pension system"<br />
CHF<br />
-800 -400 0 400 800<br />
CHF<br />
-800 -400 0 400 800<br />
CHF<br />
-800 -400 0 400 800<br />
Non-dynamic Quasi-dynamic<br />
After programme start<br />
2 5 8 11 14 17 20 22<br />
months after programme start<br />
2 5 8 11 14 17 20 23 26 29 32 35 38 40<br />
months in benefit entitlement period<br />
2 5 8 11 14 17 20 23 26 29 32<br />
months since registration<br />
CHF<br />
-800 -400 0 400 800<br />
2 5 8 11 14 17 20 23<br />
months after programme start<br />
In benefit entitlement period<br />
CHF<br />
-800 -400 0 400 800<br />
2 5 8 11 14 17 20 23 26 29 32 35 38 40<br />
months in benefit entitlement period<br />
After registration<br />
CHF<br />
-800-400 0 400 800<br />
2 5 8 11 14 17 20 23 26 29 32<br />
months since registration
5.3.3 No information in the pension system<br />
Table 5-7 Results for outcome "No information in the pension system "<br />
%<br />
-30 -20 -10 0 10 20 30<br />
%<br />
-30 -20 -10 0 10 20 30<br />
%<br />
-30 -20 -10 0 10 20 30<br />
22<br />
Non-dynamic Quasi-dynamic<br />
After programme start<br />
2 5 8 11 14 17 20 22<br />
months after programme start<br />
2 5 8 11 14 17 20 23 26 29 32 35 38 40<br />
months in benefit entitlement period<br />
2 5 8 11 14 17 20 23 26 29 32<br />
months since registration<br />
%<br />
-40 -20 0 20 40<br />
2 5 8 11 14 17 20 23<br />
months after programme start<br />
In benefit entitlement period<br />
%<br />
-40 -20 0 20 40<br />
2 5 8 11 14 17 20 23 26 29 32 35 38 40<br />
months in benefit entitlement period<br />
Since registration<br />
%<br />
-40 -20 0 20 40<br />
2 5 8 11 14 17 20 23 26 29 32<br />
months since registration<br />
The outcome "no information in pension system" is directly related to welfare dependency and<br />
out <strong>of</strong> labour force status, though these two issues can't be disentangled with the underlying<br />
data (welfare payments are not subject to pension system contributions). For the first time the<br />
effects are not reversed between the two methods. In fact, the non-dynamic variant shows an<br />
effect that would be more in favour <strong>of</strong> programmes. However, effects are negative throughout,<br />
which means that persons in programmes are less likely to "drop out <strong>of</strong> the system".
23<br />
5.3.4 Total income according to pension system data<br />
Table 5-8 Results for outcome "Total income according to pension system"<br />
CHF<br />
-800-400 0 400 800<br />
CHF<br />
-800-400 0 400 800<br />
CHF<br />
-800 -400 0 400 800<br />
Non-dynamic Quasi-dynamic<br />
After programme start<br />
2 5 8 11 14 17 20 22<br />
months after programme start<br />
2 5 8 11 14 17 20 23 26 29 32 35 38 40<br />
months in benefit entitlement period<br />
2 5 8 11 14 17 20 23 26 29 32<br />
months since registration<br />
CHF<br />
-800 -400 0 400 800<br />
2 5 8 11 14 17 20 23<br />
months after programme start<br />
In benefit entitlement period<br />
CHF<br />
-800 -400 0 400 800<br />
2 5 8 11 14 17 20 23 26 29 32 35 38 40<br />
months in benefit entitlement period<br />
After registration<br />
CHF<br />
-800 -400 0 400 800<br />
2 5 8 11 14 17 20 23 26 29 32<br />
months since registration<br />
Total income from the pension system data is an indicator <strong>of</strong> what the total purchasing power<br />
<strong>of</strong> a person is. Both methods show a similar picture: participants in general are better <strong>of</strong>f after<br />
participation, and the positive effect goes on for a long time.
24<br />
5.3.5 Employment for at least 3 consecutive months<br />
Table 5-9 Results for outcome "Employed for at least 3 consecutive months"<br />
%<br />
-30 -20 -10 0 10 20 30<br />
Non-dynamic Quasi-dynamic<br />
2 5 8 11 14 17 20 22<br />
months after programme start<br />
%<br />
-40 -20 0 20 40<br />
2 5 8 11 14 17 20 23<br />
months after programme start<br />
This outcome variable rates employment as "stable" if the income spell in the pension system<br />
lasts for at least 3 months. Using the quasi-dynamic approach, the results are almost reversed<br />
compared to the non-dynamic picture. In fact, the non-dynamic method might be biased by<br />
nonparticipants who just leave unemployment after their assigned start date (one month after<br />
programme start the effect is already minus 20 percent which is hardly credible to be a causal<br />
effect). The quasi-dynamic approach does not show negative effects for any programme after<br />
four months.<br />
5.3.6 Employment with at least 90 percent <strong>of</strong> former earnings<br />
Table 5-10 Results for outcome "Employed with at least 90 percent <strong>of</strong> former earnings"<br />
%<br />
-30 -20 -10 0 10 20 30<br />
Non-dynamic Quasi-dynamic<br />
2 5 8 11 14 17 20 22<br />
months after programme start<br />
%<br />
-40 -20 0 20 40<br />
2 5 8 11 14 17 20 23<br />
months after programme start<br />
In addition to the stability criterion, this outcome variable puts a "quality" restriction on the job<br />
by applying a minimum criterion <strong>of</strong> 90 percent <strong>of</strong> former income on the earnings. For this outcome<br />
again the conclusions are just reversed. The quasi-dynamic approach shows significantly
25<br />
positive effects only after four months. None <strong>of</strong> the programme had a negative effect in the<br />
longer run.<br />
5.3.7 Earnings if not unemployed<br />
Table 5-11 Results for outcome "Earnings if not unemployed"<br />
CHF<br />
-800-400 0 400 800<br />
Non-dynamic Quasi-dynamic<br />
2 5 8 11 14 17 20 22<br />
months after programme start<br />
CHF<br />
-800 -400 0 400 800<br />
2 5 8 11 14 17 20 23<br />
months after programme start<br />
personality<br />
language<br />
computer<br />
voc. high<br />
voc. low<br />
other<br />
EP single<br />
EP coll.<br />
int_job<br />
Aggregated average Treatment Effects on the Treated compared to waiting, significance level 5%;<br />
Outcome variable: Earnings in employment <strong>of</strong> at least 3 consecutive months<br />
This outcome shows the earnings only if a person is not registered at the unemployment <strong>of</strong>fice<br />
or doesn't receive any unemployment payments at the same time. Positive effects <strong>of</strong> up to almost<br />
800 francs are found (which <strong>of</strong> course are driven by the employment effect <strong>of</strong> the programmes).<br />
5.3.8 Employment with sustainable earnings<br />
Table 5-12 Results for outcome "Employment with sustainable earnings"<br />
%<br />
-30 -20 -10 0 10 20 30<br />
Non-dynamic Quasi-dynamic<br />
2 5 8 11 14 17 20 22<br />
months after programme start<br />
%<br />
-40 -20 0 20 40<br />
2 5 8 11 14 17 20 23<br />
months after programme start
26<br />
Employment with "sustainable earnings" is classified based on family and regional information<br />
<strong>of</strong> the unemployed (number <strong>of</strong> dependent persons, canton, and agglomeration). "Sustainable"<br />
means that the earnings are higher than a computed equivalence income which defines the<br />
existence minimum in Switzerland. The results based on the quasi-dynamic approach show<br />
positive effects on this classification <strong>of</strong> employment also whereas the non-dynamic approach<br />
rates nonparticipation much higher.<br />
5.3.9 Registered at the unemployment <strong>of</strong>fice<br />
Table 5-13 Results for outcome "Registered at the unemployment <strong>of</strong>fice"<br />
%<br />
-30 -20 -10 0 10 20 30<br />
Non-dynamic Quasi-dynamic<br />
2 5 8 11 14 17 20 22<br />
months after programme start<br />
%<br />
-40 -20 0 20 40<br />
2 5 8 11 14 17 20 23<br />
months after programme start<br />
The outcome "registered at the unemployment <strong>of</strong>fice" is 1 if the corresponding person still is<br />
enrolled with the regional placement <strong>of</strong>fice and doesn't have a "stable" job with 3000 CHF income<br />
at the same time. According to the non-dynamic approach, persons are more likely to be<br />
registered whereas the quasi-dynamic approach shows that participants in almost <strong>all</strong> programmes<br />
are less likely to be registered than nonparticipants.<br />
5.3.10 Bounds<br />
One relevant policy question is the size <strong>of</strong> aggregated effects over time, for the public as well<br />
as for the unemployed. This subsection picks out two outcomes and gives lower and upper<br />
bounds for aggregated effects <strong>of</strong> programmes over time. The chosen outcomes are "income<br />
from unemployment" and "total income". The first is related to the public expenses, the second<br />
is the private pr<strong>of</strong>it <strong>of</strong> programmes. The bounds are "worst case" and "best case" bounds, i.e.<br />
simple aggregation <strong>of</strong> single time 5 percent confidence bounds. An example how to read this<br />
table: A personality course leads in average to 101 CHF more unemployment benefits aggregated<br />
over 12 months after programme start; a "worst case" bound for this is 1556 CHF more<br />
unemployment benefits, "best case" would be 1354 CHF less unemployment benefits. The total<br />
income <strong>of</strong> a participant in a personality course aggregated over 12 months after programme<br />
start is 124 CHF lower than without the programme, with an lower bound <strong>of</strong> -2020 and an<br />
upper bound <strong>of</strong> 1772 CHF.
27<br />
Grey shaded areas show "effective" programmes in the sense that even the worst case bound<br />
shows lower unemployment income or higher total income. Note that the lower income from<br />
unemployment for employment programmes are not shaded because they might be due to the<br />
income during the programme which is not counted as "income from unemployment" in the<br />
pension system data. We find clearly positive effects in the sense <strong>of</strong> total income for language<br />
courses, computer courses, vocational training, and other courses, as well as for employment<br />
programmes in single workplaces and interim jobs. The aggregated total income <strong>of</strong> participants<br />
within 12 months after programme start is between 1700 and 3250 CHF higher for effective<br />
programmes.<br />
In terms <strong>of</strong> benefit payments only interim jobs lead to less public expenses. For the other programmes<br />
the aggregated effects are not clear. Participants and computer courses and high vocational<br />
training in average received less unemployment benefits within 12 months after programme<br />
start than if they had not participated. The effect for personality, language, and low<br />
vocational courses is to the other side: in average they need more unemployment benefits.<br />
However, these effects are not significant. For employment programmes this effect is not determinable<br />
for reasons explained above.<br />
Table 5-14 Upper and lower bounds for aggregated effects<br />
Income from unemployment Total income<br />
1-23 months 1-12 months 1-23 months 1-12 months<br />
lower mean upper lower mean upper lower mean upper lower mean upper<br />
Personality -3350 -729 1891 -1354 101 1556 -5164 -808 3549 -2020 -124 1772<br />
Language -2105 -326 1452 -564 430 1423 1703 4608 7514 393 1692 2991<br />
Computer -4299 -2044 211 -1921 -659 604 2100 5802 9504 359 2015 3670<br />
Voc. high -6736 -2516 1704 -3488 -1081 1327 2357 9460 16563 70 3145 6220<br />
Voc. low -4727 -1282 2163 -1725 155 2035 232 6028 11823 -137 2283 4702<br />
Other -4664 997 6659 -2037 907 3851 295 9461 18627 -431 3258 6948<br />
Empl. sing. -8542 -5985 -3428 -6013 -4829 -3644 -408 4449 9306 656 2314 3972<br />
Empl. coll. -9851 -7509 -5168 -6893 -5787 -4682 -2701 1758 6216 -811 735 2281<br />
Interim job -6831 -5685 -4538 -5326 -4721 -4117 5609 7600 9591 2192 3047 3902<br />
Note: Aggregation is after programme start. Treatment effects are based on the quasi-dynamic matching estimator.<br />
6 Conclusion<br />
Active labour market programmes are evaluated in terms <strong>of</strong> a variety <strong>of</strong> outcomes that give a<br />
clear picture <strong>of</strong> the effectiveness <strong>of</strong> active labour market policy. The focus <strong>of</strong> the study is the<br />
effect <strong>of</strong> the treatment on the treated compared to nonparticipation. Treatment assignment and<br />
therefore nonparticipation was modelled non-dynamic<strong>all</strong>y as well as in the quasi-dynamic design<br />
<strong>of</strong> Sianesi (2004) where nonparticipation is modelled as "waiting" and more intense job<br />
search status compared to participation. The two methodologies' estimated effects for active<br />
labour market programmes in Switzerland are compared. Indeed the consideration <strong>of</strong> dynamics<br />
reverse the results compared to a non-dynamic approach.
28<br />
The outcomes show that persons who have participated in programmes are better <strong>of</strong>f than<br />
nonparticipants in almost every sense: they are more likely to be employed, where "employment"<br />
was analyzed not only quantitatively, but also qualitatively in terms <strong>of</strong> stability, purchasing<br />
power, and sustainability. Moreover, participants tend to keep in touch with the labour<br />
market longer than untreated persons, in the sense that they don't leave the labour force and<br />
they don't become welfare dependent. In general effects don't change or jump close to benefit<br />
exhaustion, so a possible effect in terms <strong>of</strong> benefit exhaustion can be ruled out or is similar in<br />
<strong>all</strong> groups.<br />
In aggregation, we find clearly positive effects in the sense <strong>of</strong> total income for language<br />
courses, computer courses, vocational training, and other courses, as well as for employment<br />
programmes in single workplaces and interim jobs. The aggregated total income <strong>of</strong> participants<br />
within 12 months after programme start is between 1700 and 3250 CHF higher for effective<br />
programmes. Subject to unemployment benefits, effects are clear only for interim jobs: they<br />
lead to less unemployment benefits.
References<br />
29<br />
Fredriksson, Peter and Per Johansson (2002), Program evaluation and random program starts, IFAU Working Paper<br />
2003:1.<br />
Frölich, Markus (2004), Programme evaluation with multiple treatments, forthcoming in Journal <strong>of</strong> Economic Surveys.<br />
Frölich, Markus, Michael Lechner, and Heidi Steiger (2003), Statistic<strong>all</strong>y Assisted Programme Selection – International<br />
Experiences and Potential Benefits for Switzerland, Swiss Journal <strong>of</strong> Economics and Statistics, 139, 311-331.<br />
Gerfin, Michael, and Michael Lechner (2002); Microeconometric Evaluation <strong>of</strong> the Active Labour Market Policy in Switzerland,<br />
The Economic Journal, 112 (482), 854-893<br />
Gerfin, Michael, Michael Lechner, and Heidi Steiger (2002), Does subsidised temporary employment get the unemployed<br />
back to work? An econometric analysis <strong>of</strong> two different schemes, Discussion Paper 2002-22, Department <strong>of</strong> Economics,<br />
University <strong>of</strong> St. G<strong>all</strong>en.<br />
Heckman, James J., Robert LaLonde, and Jeffrey Smith (1999), The Economics and Econometrics <strong>of</strong> Active Labor Market<br />
Programs, in O. Ashenfelter and D. Card (eds.), Handbook <strong>of</strong> Labor Economics, Volume 3A. Amsterdam: North-<br />
Holland: 1865-2097.<br />
Lalive, Rafael, Jan van Ours, and Josef Zweimüller (2002), The Effect <strong>of</strong> Benefit Sanctions on the Duration <strong>of</strong> Unemployment,<br />
IZA Discussion Papers 469, Institute for the Study <strong>of</strong> Labor (IZA).<br />
Lechner, Michael (2001a), A note on the common support problem in applied evaluation studies, Discussion Paper 2001-<br />
01, Department <strong>of</strong> Economics, University <strong>of</strong> St. G<strong>all</strong>en<br />
Lechner, Michael (2001b), Identification and Estimation <strong>of</strong> Causal Effects <strong>of</strong> Multiple Treatments under the Conditional<br />
Independence Assumption, in: Lechner, M., Pfeiffer, F. (eds), Econometric Evaluation <strong>of</strong> Labour Market Policies,<br />
Heidelberg: Physica/Springer, 2001, p. 43-58<br />
Lechner, Michael (2002), Some practical issues in the evaluation <strong>of</strong> heterogeneous labour market programmes by matching<br />
methods, Journal <strong>of</strong> the Royal Statistical Society - Series A, 165/1, 59-82<br />
Sianesi, Barbara (2004), An Evaluation <strong>of</strong> the Swedish Active Labour Market Programmes, IFAU working paper 2001:5,<br />
forthcoming in the Review <strong>of</strong> Economics and Statistics.
30<br />
<strong>Appendix</strong> A. Sample selection rules<br />
The selection procedure starts from the total sample <strong>of</strong> pension system records available for<br />
the corresponding sample and selects step by step people with described characteristics.<br />
Table A-1 Sample restrictions<br />
Sample restrictions according to Lechner and Gerfin<br />
Initial number <strong>of</strong> observations 81'399 †<br />
First selection: personal characteristics<br />
No missing data about insured earnings in current unemployment spell<br />
Age 25 to 55<br />
No disability<br />
Earnings in last job > 100 CHF<br />
Only Swiss citizens and foreigners with at least yearly permit<br />
No homeworkers/trainees/students<br />
Information about duration <strong>of</strong> entitlement period available<br />
Remaining observations 70'680<br />
Second selection: unemployment duration<br />
Not long-term unemployed on 31 st <strong>of</strong> December 1997<br />
Beginning <strong>of</strong> spell is earlier than end <strong>of</strong> spell<br />
Has been registered as unemployed on 31 st December 1997<br />
Benefit entitlement not yet exhausted before 31 st December 1997<br />
Remaining observations 67'191<br />
Third selection: programme participation<br />
No significant programme participation according to AVAM (courses and empl. programmes) or<br />
ASAL (interim jobs) before 1998<br />
Programme doesn’t start on 1 st <strong>of</strong> January 1998<br />
Person has not participated in any other programme not considered in this study<br />
Remaining observations 34'393<br />
Fourth selection: pension system data<br />
Has been employed before at least once<br />
Remaining observations SAMPLE A 33'700<br />
After randomising programme start dates for nonparticipants (-7'367) 26'333<br />
After common support restriction (-4'778) SAMPLE B 21'555<br />
Note: † This sample is a random sub-sample <strong>of</strong> the underlying population, but after already having applied some <strong>of</strong> the here<br />
mentioned selection criteria on the population. The numbers <strong>of</strong> observations deleted due to these criteria hence<br />
should not be interpreted as shares in the total population <strong>of</strong> unemployed in Switzerland.
<strong>Appendix</strong> B. <strong>Further</strong> <strong>statistics</strong> <strong>of</strong> <strong>all</strong> <strong>samples</strong><br />
Table B-1: Descriptive Statistics<br />
Sample A Sample B<br />
21'555 33'700<br />
Programme participation (in %)<br />
No course 0.32 0.47<br />
Personality course 0.05 0.04<br />
Language course 0.09 0.08<br />
Basic computer course 0.08 0.06<br />
Vocational training high level 0.02 0.02<br />
Vocational training low level 0.03 0.02<br />
Other training 0.02 0.01<br />
Employment programme public 0.07 0.05<br />
Employment programme private 0.07 0.05<br />
Temporary wage subsidy 0.25 0.20<br />
Begin <strong>of</strong> programme in calendar time (1=1.1.1998) 101.06 59.14<br />
Duration <strong>of</strong> current unemployment spell at beginning <strong>of</strong> first programme 94.66 206.26<br />
Remaining time <strong>of</strong> benefit entitlement at beginning <strong>of</strong> programme (only people in 412.46 442.59<br />
courses and empl. programmes) in days<br />
Duration <strong>of</strong> first programme (only people in courses and empl. programmes) 40.28 94.20<br />
Current unemployment spell<br />
Duration <strong>of</strong> current unemployment, 31.12.1997 151.03 147.12<br />
Unemployment benefit, daily, CHF 139.09 137.63<br />
Beginning <strong>of</strong> benefit entitlement period in months since 1996 (1=Jan1996) 17.68 17.31<br />
Number <strong>of</strong> days <strong>of</strong> cancelled benefits (as sanction) in 1997 4.72 4.75<br />
Other personal characteristics<br />
Age in years 37.64 37.75<br />
Younger than 30 0.20 0.20<br />
Older than 50 0.12 0.13<br />
Female 0.44 0.46<br />
Number <strong>of</strong> additional persons in same household 1.41 1.44<br />
At least one additional person in same household 0.69 0.70<br />
Mother tongue<br />
German 0.35 0.34<br />
French 0.20 0.18<br />
Italian 0.10 0.11<br />
Other 0.35 0.37<br />
Language spoken in canton <strong>of</strong> residence 0.54 0.52<br />
German/French/Italian, but not canton language 0.11 0.11<br />
Foreign languages<br />
Number <strong>of</strong> foreign languages 1.42 1.43<br />
Marital status<br />
Single 0.28 0.26<br />
Married 0.59 0.61<br />
Widowed 0.01 0.01<br />
Divorced 0.13 0.12<br />
Nationality<br />
Swiss 0.56 0.54<br />
Foreign with permanent permit 0.29 0.30<br />
Foreign with yearly permit 0.14 0.17<br />
Qualification<br />
Skilled 0.57 0.54<br />
Semi-skilled 0.16 0.15<br />
Unskilled 0.27 0.31<br />
table continues on next page<br />
31
table continued<br />
Sample A Sample B<br />
Caseworker's subjective rating <strong>of</strong> employability<br />
No information 0.05 0.05<br />
Very easy 0.05 0.06<br />
Easy 0.15 0.15<br />
Medium 0.58 0.55<br />
Difficult 0.15 0.15<br />
Special case<br />
Mobility<br />
0.02 0.02<br />
Not mobile 0.09 0.09<br />
Daily commuter 0.87 0.86<br />
Mobile within parts <strong>of</strong> Switzerland 0.03 0.02<br />
Mobile within whole <strong>of</strong> Switzerland 0.01 0.02<br />
Mobile abroad<br />
Looking for ... job<br />
0.01 0.01<br />
Full-time 0.36 0.36<br />
Part-time 0.14 0.15<br />
No information<br />
Unemployment status<br />
0.49 0.49<br />
Full-time 0.82 0.81<br />
Part-time 0.16 0.16<br />
In part-time employment 0.01 0.02<br />
Other<br />
Monthly earnings in last job<br />
0.01 0.01<br />
Monthly earnings in CHF 3882.88 3839.75<br />
Less than 1000 CHF 0.02 0.02<br />
Between 1000 and 2000 0.09 0.10<br />
Between 2000 and 3000 0.19 0.20<br />
Between 3000 and 4000 0.25 0.25<br />
Between 4000 and 5000 0.24 0.22<br />
Between 5000 and 6000 0.11 0.11<br />
More than 6000<br />
Job position<br />
0.09 0.10<br />
Self-employed 0.01 0.01<br />
High (management, etc.) 0.06 0.06<br />
Medium 0.58 0.55<br />
Low<br />
Canton<br />
0.35 0.38<br />
Zurich 0.20 0.21<br />
Berne 0.09 0.09<br />
Lucerne 0.04 0.04<br />
Uri 0.00 0.00<br />
Schwyz 0.01 0.01<br />
Obwalden 0.00 0.00<br />
Nidwalden 0.00 0.00<br />
Glarus 0.00 0.00<br />
Zug 0.01 0.01<br />
Fribourg 0.03 0.03<br />
Solothurn 0.03 0.03<br />
Basle-Town 0.03 0.04<br />
Basle-Country 0.02 0.02<br />
Schaffhausen 0.01 0.01<br />
Appenzell Outer Rhodes 0.00 0.00<br />
Appenzell Inner-Rhodes 0.00 0.00<br />
St. G<strong>all</strong> 0.05 0.05<br />
Grisons 0.01 0.01<br />
Argovia 0.06 0.05<br />
Thurgovia 0.02 0.02<br />
Ticino 0.05 0.08<br />
Vaud<br />
table continues on next page<br />
0.14 0.12<br />
32
table continued<br />
Sample A Sample B<br />
Valais 0.05 0.05<br />
Neuchâtel 0.03 0.03<br />
Geneva 0.08 0.08<br />
Jura<br />
Canton language<br />
0.01 0.01<br />
French 0.34 0.32<br />
Italien 0.07 0.09<br />
German<br />
Region<br />
0.59 0.59<br />
East 0.10 0.10<br />
Central 0.07 0.06<br />
North-West 0.14 0.14<br />
Middle (Bern) 0.09 0.09<br />
Romandie (French speaking part) 0.34 0.32<br />
Zurich 0.20 0.21<br />
Italian speaking part<br />
Size <strong>of</strong> town where worked before<br />
0.05 0.08<br />
>=200’000 0.08 0.08<br />
table continued<br />
Sample A Sample B<br />
Paper 0.00 0.00<br />
Graphics 0.02 0.02<br />
Leather 0.00 0.00<br />
Chemistry 0.01 0.01<br />
Stone 0.01 0.01<br />
Metals 0.03 0.02<br />
Machinery 0.03 0.03<br />
Electronics 0.02 0.02<br />
Watches/jewellery 0.01 0.01<br />
Other industry 0.01 0.01<br />
Construction 0.13 0.12<br />
Trade 0.16 0.15<br />
Hotel industry 0.13 0.15<br />
Repairing 0.02 0.02<br />
Transportation 0.03 0.03<br />
Communication 0.00 0.00<br />
Banking 0.03 0.03<br />
Real estate 0.01 0.01<br />
Consulting 0.12 0.11<br />
Teaching 0.02 0.02<br />
R&D 0.00 0.00<br />
Health care 0.04 0.04<br />
Other services 0.10 0.10<br />
Civil services 0.04 0.04<br />
Unemployment rate in industry, 12/1997<br />
Employment history from pension system data<br />
6.38 6.60<br />
Uninterrupted history in pension system since registration or 1988 0.70 0.68<br />
Uninterrupted history in pension system since 1993 0.74 0.72<br />
Person was self-employed at least once since 1988 0.08 0.08<br />
Person was self-employed at least once since 1993 0.05 0.05<br />
Number <strong>of</strong> unemployment spells since registration or 1988 0.28 0.30<br />
Number <strong>of</strong> unemployment spells since 1993 0.83 0.89<br />
Was out <strong>of</strong> labour force since registration or 1988 0.15 0.15<br />
Number <strong>of</strong> months out <strong>of</strong> labour force since registration or 1988 1.87 1.89<br />
Was out <strong>of</strong> labour force since registration or 1993 0.18 0.18<br />
Income from employment (in 1000 CHF, inflation corr.) 1988 29.94 29.92<br />
1989 32.49 32.30<br />
1990 36.79 35.61<br />
1991 36.58 36.66<br />
1992 35.59 36.52<br />
1993 36.55 35.53<br />
1994 38.53 36.65<br />
1995 39.59 38.35<br />
1996 24.86 38.91<br />
1997 24.86 25.09<br />
Income from unemployment (in 1000 CHF, inflation corr.) 1988 0.14 0.20<br />
1989 0.13 0.18<br />
1990 0.17 0.22<br />
1991 0.56 0.60<br />
1992 1.66 1.70<br />
1993 3.50 3.54<br />
1994 2.87 2.94<br />
1995 2.30 2.40<br />
1996 1.91 2.29<br />
1997 12.74 12.39<br />
Immigrated to Switzerland 1988-1992 .05 0.06<br />
Immigrated to Switzerland 1993-1997<br />
table continues on next page<br />
.05 0.05<br />
34
table continued<br />
Sample A Sample B<br />
No information in pension system for 1998 0.00 0.01<br />
No information in pension system for 1999 0.09 0.10<br />
Number <strong>of</strong> months unemployed since entry into social security system or since 1988 10.21 10.48<br />
Number <strong>of</strong> months employed since entry into social security system or since 1988 87.10 85.74<br />
Never unemployed 0.08 0.08<br />
Month <strong>of</strong> entry into pension system (1=January 1988) 13.49 14.13<br />
Number <strong>of</strong> employment spells since 1988 2.30 2.38<br />
Number <strong>of</strong> unemployment spells since 1988 1.80 1.87<br />
Mean duration <strong>of</strong> employment spell in months 55.63 53.64<br />
Mean duration <strong>of</strong> unemployment spell in months 5.18 5.17<br />
Max. duration <strong>of</strong> employment spell in month 70.86 69.25<br />
Max. duration <strong>of</strong> unemployment spell in month 6.84 6.88<br />
Standard deviation <strong>of</strong> wages 1232.31 1313.86<br />
Duration <strong>of</strong> last employment spell in months 52.60 50.23<br />
Wage growth during last employment spell (inflation corrected) 0.01 0.01<br />
Proportion <strong>of</strong> time unemployed in % 0.10 0.11<br />
Proportion <strong>of</strong> time employed in % 0.81 0.80<br />
Mean wage 1988 2703.77 2716.2<br />
1989 2928.22 2927.58<br />
1990 3197.88 3219.62<br />
1991 3298.35 3306.75<br />
1992 3303.71 3313.09<br />
1993 3233.26 3242.38<br />
1994 3322.18 3451.41<br />
1995 3476.28 3483.09<br />
1996 3622.91 3596.84<br />
1997 3050.08 3078.53<br />
Graph B-1: Numbers <strong>of</strong> observations left in different outcome measures for Sample A<br />
number <strong>of</strong> observations<br />
5000 10000 15000 20000<br />
35<br />
2 5 8 11 14 17 20 23 26 29 32 35 38 41 44 47<br />
months<br />
after prog. start<br />
in entitl. period<br />
after registration
Graph B-2: Descriptive <strong>statistics</strong> <strong>of</strong> outcomes by treatment categories<br />
Outcome a<br />
Outcome c<br />
Outcome e<br />
Outcome g<br />
Outcome i<br />
Outcome k<br />
%<br />
20 40 60 80<br />
%<br />
20 40 60 80<br />
CHF<br />
1000 2000 3000<br />
%<br />
20 40 60 80<br />
CHF<br />
1000 2000 3000<br />
%<br />
20 40 60 80<br />
After programme start<br />
2 5 8 11 14 17 20 22<br />
months after programme start<br />
2 5 8 11 14 17 20 22<br />
months after programme start<br />
2 5 8 11 14 17 20 22<br />
months after programme start<br />
2 5 8 11 14 17 20 22<br />
months after programme start<br />
2 5 8 11 14 17 20 22<br />
months after programme start<br />
2 5 8 11 14 17 20 22<br />
months after programme start<br />
graphs continued on next page<br />
36<br />
Outcome b<br />
Outcome d<br />
Outcome f<br />
Outcome h<br />
Outcome j<br />
%<br />
20 40 60 80<br />
CHF<br />
1000 2000 3000<br />
CHF<br />
1000 2000 3000<br />
%<br />
20 40 60 80<br />
%<br />
20 40 60 80<br />
After programme start<br />
2 5 8 11 14 17 20 22<br />
months after programme start<br />
2 5 8 11 14 17 20 22<br />
months after programme start<br />
2 5 8 11 14 17 20 22<br />
months after programme start<br />
2 5 8 11 14 17 20 22<br />
months after programme start<br />
2 5 8 11 14 17 20 22<br />
months after programme start
graphs continued<br />
Outcome f<br />
Outcome g<br />
Outcome h<br />
Outcome i<br />
Outcome j<br />
Outcome k<br />
%<br />
20 40 60 80<br />
%<br />
20 40 60 80<br />
%<br />
20 40 60 80<br />
CHF<br />
100020003000<br />
CHF<br />
1000 2000 3000<br />
CHF<br />
100020003000<br />
37<br />
In entitlement period After registration<br />
2 5 8 11 14 17 20 23 26 29 32 35 38 41 44 47<br />
months in benefit entitlement period<br />
2 5 8 11 14 17 20 23 26 29 32 35 38 41 44 47<br />
months in benefit entitlement period<br />
2 5 8 11 14 17 20 23 26 29 32 35 38 41 44 47<br />
months in benefit entitlement period<br />
2 5 8 11 14 17 20 23 26 29 32 35 38 41 44 47<br />
months in benefit entitlement period<br />
2 5 8 11 14 17 20 23 26 29 32 35 38 41 44 47<br />
months in benefit entitlement period<br />
2 5 8 11 14 17 20 23 26 29 32 35 38 41 44 47<br />
months in benefit entitlement period<br />
%<br />
20 40 60 80<br />
%<br />
20 40 60 80<br />
%<br />
20 40 60 80<br />
CHF<br />
1000 2000 3000<br />
CHF<br />
1000 2000 3000<br />
CHF<br />
1000 2000 3000<br />
2 5 8 11 14 17 20 23 26 29 32 35<br />
months since registration<br />
2 5 8 11 14 17 20 23 26 29 32 35<br />
months since registration<br />
2 5 8 11 14 17 20 23 26 29 32 35<br />
months since registration<br />
2 5 8 11 14 17 20 23 26 29 32 35<br />
months since registration<br />
2 5 8 11 14 17 20 23 26 29 32 35<br />
months since registration<br />
2 5 8 11 14 17 20 23 26 29 32 35<br />
months since registration
Table B-2: Numbers <strong>of</strong> persons starting programme at what time (quasi-dynamic matching)<br />
38<br />
Personal. Lang. Comp. Voc. high Voc. low Other EP single EP coll. Int. job<br />
t (1) (2) (1) (2) (1) (2) (1) (2) (1) (2) (1) (2) (1) (2) (1) (2) (1) (2)<br />
1<br />
2 33 42 107 121 80 88 14 25 13 17 9 7 13 21 8 20 241 424<br />
3 88 108 189 278 219 232 40 44 34 47 17 31 29 49 33 62 435 663<br />
4 109 145 242 310 217 267 56 71 45 62 15 21 67 96 59 86 487 708<br />
5 110 143 278 316 175 235 49 68 52 69 29 39 75 116 74 102 421 661<br />
6 97 114 225 225 146 179 48 53 48 60 23 29 96 122 109 116 427 548<br />
7 82 88 200 219 149 161 43 40 50 63 23 26 93 112 97 118 392 526<br />
8 65 69 165 196 119 137 34 44 51 53 21 28 104 127 133 143 366 473<br />
9 73 85 147 162 97 100 41 46 41 41 17 18 116 132 104 129 344 380<br />
10 74 79 144 156 93 95 40 39 43 50 23 22 104 103 111 126 336 361<br />
11 77 89 154 164 91 80 29 37 47 46 16 16 133 128 109 120 316 336<br />
12 65 59 142 137 67 75 23 27 36 48 23 23 128 132 112 117 333 324<br />
13 83 82 153 142 88 84 36 34 48 43 24 22 125 119 113 119 378 345<br />
14 72 54 124 71 58 35 25 22 29 27 27 25 118 117 120 122 381 236<br />
15 43 28 88 65 52 33 21 18 32 20 20 22 100 78 124 102 285 160<br />
16 42 35 70 38 50 26 13 10 33 16 13 11 98 89 97 92 291 152<br />
17 27 21 57 27 28 20 19 11 18 8 17 10 96 64 86 65 241 139<br />
18 28 9 35 23 25 16 13 7 16 11 14 7 80 52 87 59 184 93<br />
19 32 21 42 15 24 8 17 5 18 3 8 3 57 36 84 47 176 79<br />
20 28 42 35 11 17 9 40 61 160<br />
21 25 31 16 6 12 11 31 37 122<br />
22 18 25 22 14 11 11 20 31 146<br />
23 9 23 21 5 7 11 8 124<br />
24 3 7 8 7 3 3 114<br />
25 8 4 3 4 60<br />
26 3 3 7 5 17<br />
27 3 5 10<br />
28 3 9<br />
29 5 5<br />
30 4 6<br />
31 4<br />
tot 1286 1271 2701 2665 1884 1871 607 601 704 684 370 360 1755 1693 1815 1745 6811 6608<br />
Note: Only cells with at least 3 observations are counted. Time frame (1): months in entitlement period. (2): months since<br />
registration. The number <strong>of</strong> participants in (1) and (2) differ slightly because both time frames were "cut" above (31<br />
and 19 months, respectively). This cut affected the number <strong>of</strong> participants a bit stronger in the registration time<br />
frame.