2 Right Censoring and Kaplan-Meier Estimator - NCSU Statistics
2 Right Censoring and Kaplan-Meier Estimator - NCSU Statistics
2 Right Censoring and Kaplan-Meier Estimator - NCSU Statistics

You also want an ePaper? Increase the reach of your titles
YUMPU automatically turns print PDFs into web optimized ePapers that Google loves.
CHAPTER 2 ST 745, Daowen Zhang<br />
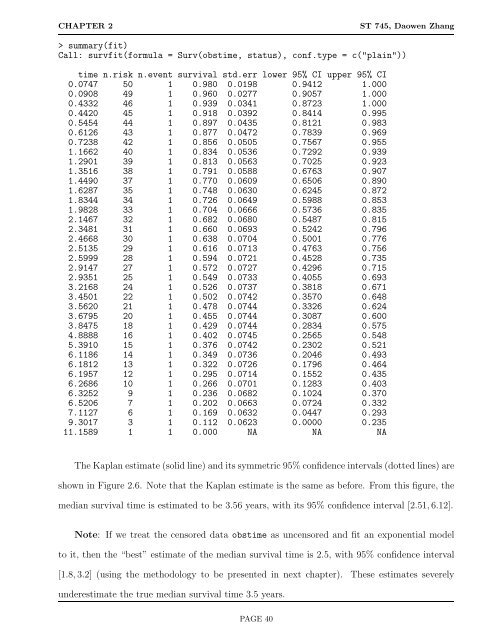
> summary(fit)<br />
Call: survfit(formula = Surv(obstime, status), conf.type = c("plain"))<br />
time n.risk n.event survival std.err lower 95% CI upper 95% CI<br />
0.0747 50 1 0.980 0.0198 0.9412 1.000<br />
0.0908 49 1 0.960 0.0277 0.9057 1.000<br />
0.4332 46 1 0.939 0.0341 0.8723 1.000<br />
0.4420 45 1 0.918 0.0392 0.8414 0.995<br />
0.5454 44 1 0.897 0.0435 0.8121 0.983<br />
0.6126 43 1 0.877 0.0472 0.7839 0.969<br />
0.7238 42 1 0.856 0.0505 0.7567 0.955<br />
1.1662 40 1 0.834 0.0536 0.7292 0.939<br />
1.2901 39 1 0.813 0.0563 0.7025 0.923<br />
1.3516 38 1 0.791 0.0588 0.6763 0.907<br />
1.4490 37 1 0.770 0.0609 0.6506 0.890<br />
1.6287 35 1 0.748 0.0630 0.6245 0.872<br />
1.8344 34 1 0.726 0.0649 0.5988 0.853<br />
1.9828 33 1 0.704 0.0666 0.5736 0.835<br />
2.1467 32 1 0.682 0.0680 0.5487 0.815<br />
2.3481 31 1 0.660 0.0693 0.5242 0.796<br />
2.4668 30 1 0.638 0.0704 0.5001 0.776<br />
2.5135 29 1 0.616 0.0713 0.4763 0.756<br />
2.5999 28 1 0.594 0.0721 0.4528 0.735<br />
2.9147 27 1 0.572 0.0727 0.4296 0.715<br />
2.9351 25 1 0.549 0.0733 0.4055 0.693<br />
3.2168 24 1 0.526 0.0737 0.3818 0.671<br />
3.4501 22 1 0.502 0.0742 0.3570 0.648<br />
3.5620 21 1 0.478 0.0744 0.3326 0.624<br />
3.6795 20 1 0.455 0.0744 0.3087 0.600<br />
3.8475 18 1 0.429 0.0744 0.2834 0.575<br />
4.8888 16 1 0.402 0.0745 0.2565 0.548<br />
5.3910 15 1 0.376 0.0742 0.2302 0.521<br />
6.1186 14 1 0.349 0.0736 0.2046 0.493<br />
6.1812 13 1 0.322 0.0726 0.1796 0.464<br />
6.1957 12 1 0.295 0.0714 0.1552 0.435<br />
6.2686 10 1 0.266 0.0701 0.1283 0.403<br />
6.3252 9 1 0.236 0.0682 0.1024 0.370<br />
6.5206 7 1 0.202 0.0663 0.0724 0.332<br />
7.1127 6 1 0.169 0.0632 0.0447 0.293<br />
9.3017 3 1 0.112 0.0623 0.0000 0.235<br />
11.1589 1 1 0.000 NA NA NA<br />
The <strong>Kaplan</strong> estimate (solid line) <strong>and</strong> its symmetric 95% confidence intervals (dotted lines) are<br />
shown in Figure 2.6. Note that the <strong>Kaplan</strong> estimate is the same as before. From this figure, the<br />
median survival time is estimated to be 3.56 years, with its 95% confidence interval [2.51, 6.12].<br />
Note: If we treat the censored data obstime as uncensored <strong>and</strong> fit an exponential model<br />
to it, then the “best” estimate of the median survival time is 2.5, with 95% confidence interval<br />
[1.8, 3.2] (using the methodology to be presented in next chapter). These estimates severely<br />
underestimate the true median survival time 3.5 years.<br />
PAGE 40