2 Right Censoring and Kaplan-Meier Estimator - NCSU Statistics
2 Right Censoring and Kaplan-Meier Estimator - NCSU Statistics
2 Right Censoring and Kaplan-Meier Estimator - NCSU Statistics

Create successful ePaper yourself
Turn your PDF publications into a flip-book with our unique Google optimized e-Paper software.
CHAPTER 2 ST 745, Daowen Zhang<br />
Table 2.4: Life-table estimate of S(5) assuming censoring occurred during the interval<br />
duration [ti−1,ti) n(x) d(x) w(x) �m(x) =<br />
d(x)<br />
n(x)−w(x)/2 1 − �m(x) � S LT (ti) = � (1 − �m(x))<br />
[0, 1) 146 27 3 0.187 0.813 0.813<br />
[1, 2) 116 18 10 0.162 0.838 0.681<br />
[2, 3) 88 21 10 0.253 0.747 0.509<br />
[3, 4) 57 9 3 0.162 0.838 0.426<br />
[4, 5) 45 1 3 0.023 0.977 0.417<br />
That is, when calculating the mortality estimate in each interval, we use (n(x) − w(x)/2) as<br />
the “sample size”. This number is often referred to as the effective sample size.<br />
So the 5 year survival probability estimate � S LT (5) = 0.417, which is between � S L =0.400 <strong>and</strong><br />
�S R =0.432.<br />
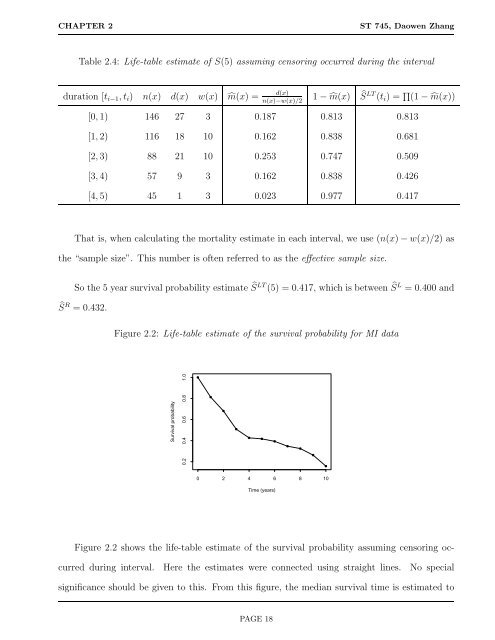
Figure 2.2: Life-table estimate of the survival probability for MI data<br />
Survival probability<br />
0.2 0.4 0.6 0.8 1.0<br />
0 2 4 6 8 10<br />
Time (years)<br />
Figure 2.2 shows the life-table estimate of the survival probability assuming censoring oc-<br />
curred during interval. Here the estimates were connected using straight lines. No special<br />
significance should be given to this. From this figure, the median survival time is estimated to<br />
PAGE 18