

ANNUAL
ENKAI_ANNUAL_REPORT_31122016
ENKAI_ANNUAL_REPORT_31122016

You also want an ePaper? Increase the reach of your titles
YUMPU automatically turns print PDFs into web optimized ePapers that Google loves.
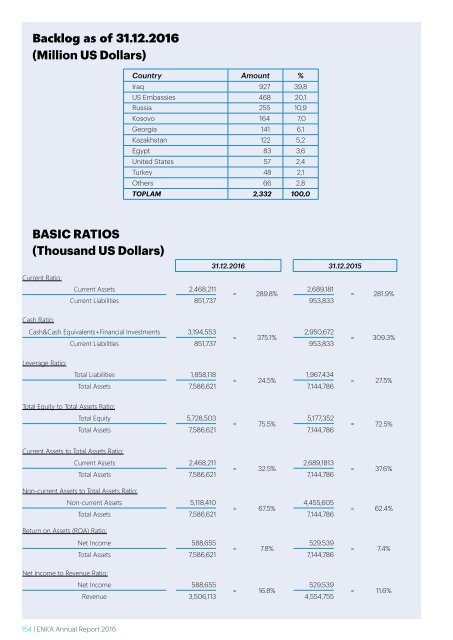
Backlog as of 31.12.2016<br />
(Million US Dollars)<br />
Country Amount %<br />
Iraq 927 39,8<br />
US Embassies 468 20,1<br />
Russia 255 10,9<br />
Kosovo 164 7,0<br />
Georgia 141 6,1<br />
Kazakhstan 122 5,2<br />
Egypt 83 3,6<br />
United States 57 2,4<br />
Turkey 48 2,1<br />
Others 66 2,8<br />
TOPLAM 2,332 100,0<br />
BASIC RATIOS<br />
(Thousand US Dollars)<br />
31.12.2016 31.12.2015<br />
Current Ratio:<br />
Current Assets 2,468,211<br />
= 289.8%<br />
2,689,181<br />
= 281.9%<br />
Current Liabilities 851,737 953,833<br />
Cash Ratio:<br />
Cash&Cash Equivalents+Financial Investments 3,194,553<br />
2,950,672<br />
= 375.1%<br />
Current Liabilities 851,737 953,833<br />
= 309.3%<br />
Leverage Ratio:<br />
Total Liabilities 1,858,118<br />
1,967,434<br />
= 24.5%<br />
Total Assets 7,586,621 7,144,786<br />
= 27.5%<br />
Total Equity to Total Assets Ratio:<br />
Total Equity 5,728,503<br />
5,177,352<br />
= 75.5%<br />
Total Assets 7,586,621 7,144,786<br />
= 72.5%<br />
Current Assets to Total Assets Ratio:<br />
Current Assets 2,468,211<br />
2,689,1813<br />
= 32.5%<br />
Total Assets 7,586,621 7,144,786<br />
Non-current Assets to Total Assets Ratio:<br />
Non-current Assets 5,118,410<br />
4,455,605<br />
= 67.5%<br />
Total Assets 7,586,621 7,144,786<br />
Return on Assets (ROA) Ratio:<br />
Net Income 588,655<br />
529,539<br />
= 7.8%<br />
Total Assets 7,586,621 7,144,786<br />
Net Income to Revenue Ratio:<br />
Net Income 588,655<br />
529,539<br />
= 16.8%<br />
Revenue 3,506,113 4,554,755<br />
= 37.6%<br />
= 62.4%<br />
= 7.4%<br />
= 11.6%<br />
154 | ENKA Annual Report 2016<br />
ENKA Annual Report 2016 | 155