

ANNUAL
ENKAI_ANNUAL_REPORT_31122016
ENKAI_ANNUAL_REPORT_31122016

Create successful ePaper yourself
Turn your PDF publications into a flip-book with our unique Google optimized e-Paper software.
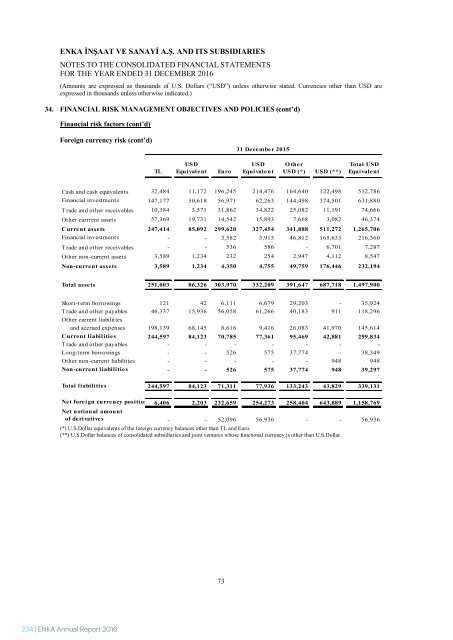
ENKA İNŞAAT VE SANAYİ A.Ş. AND ITS SUBSIDIARIES<br />
NOTES TO THE CONSOLIDATED FINANCIAL STATEMENTS<br />
FOR THE YEAR ENDED 31 DECEMBER 2016<br />
(Amounts are expressed as thousands of U.S. Dollars (“USD”) unless otherwise stated. Currencies other than USD are<br />
expressed in thousands unless otherwise indicated.)<br />
34. FINANCIAL RISK MANAGEMENT OBJECTIVES AND POLICIES (cont’d)<br />
Financial risk factors (cont’d)<br />
Foreign currency risk (cont’d)<br />
TL<br />
USD<br />
Equ i val e n t<br />
Eu ro<br />
31 December 2015<br />
USD<br />
Equ i val e n t<br />
O ther<br />
USD (*) USD (**)<br />
Total USD<br />
Equivalent<br />
Cash and cash equivalents 32,484 11,172 196,245 214,476 164,640 122,498 512,786<br />
Financial investments 147,177 50,618 56,971 62,263 144,498 374,501 631,880<br />
T rade and other receivables 10,384 3,571 31,862 34,822 25,082 11,191 74,666<br />
Other currrent assets 57,369 19,731 14,542 15,893 7,668 3,082 46,374<br />
Current assets 247,414 85,092 299,620 327,454 341,888 511,272 1,265,706<br />
Financial investments - - 3,582 3,915 46,812 165,633 216,360<br />
T rade and other receivables - - 536 586 - 6,701 7,287<br />
Other non-current assets 3,589 1,234 232 254 2,947 4,112 8,547<br />
Non-current assets 3,589 1,234 4,350 4,755 49,759 176,446 232,194<br />
Total assets 251,003 86,326 303,970 332,209 391,647 687,718 1,497,900<br />
Short-term borrowings 121 42 6,111 6,679 29,203 - 35,924<br />
Trade and other payables 46,337 15,936 56,058 61,266 40,183 911 118,296<br />
Other current liabilities<br />
and accrued expenses 198,139 68,145 8,616 9,416 26,083 41,970 145,614<br />
Current liabilities 244,597 84,123 70,785 77,361 95,469 42,881 299,834<br />
Trade and other payables - - - - - - -<br />
Long-term borrowings - - 526 575 37,774 - 38,349<br />
Other non-current liabilities - - - - - 948 948<br />
Non-current liabilities - - 526 575 37,774 948 39,297<br />
Total liabilities 244,597 84,123 71,311 77,936 133,243 43,829 339,131<br />
Net foreign currency position 6,406 2,203 232,659 254,273 258,404 643,889 1,158,769<br />
Net notional amount<br />
of de ri vative s - - 52,096 56,936 - - 56,936<br />
(*) U.S.Dollar equivalents of the foreign currency balances other than TL and Euro.<br />
(**) U.S.Dollar balances of consolidated subsidiaries and joint ventures whose functional currency is other than U.S.Dollar.<br />
ENKA İNŞAAT VE SANAYİ A.Ş. AND ITS SUBSIDIARIES<br />
NOTES TO THE CONSOLIDATED FINANCIAL STATEMENTS<br />
FOR THE YEAR ENDED 31 DECEMBER 2016<br />
(Amounts are expressed as thousands of U.S. Dollars (“USD”) unless otherwise stated. Currencies other than USD are<br />
expressed in thousands unless otherwise indicated.)<br />
34. FINANCIAL RISK MANAGEMENT OBJECTIVES AND POLICIES (cont’d)<br />
Financial risk factors (cont’d)<br />
Foreign currency risk (cont’d)<br />
The details of the forward contracts and sales-purchase agreements are explained in Note 18 in order to manage<br />
Group’s foreign currency position.<br />
The following table demonstrates the sensitivity to reasonably possible increase of 10% in the exchange rates<br />
against functional currency, with all other variables held constant, of the Group’s consolidated statement of profit<br />
or loss.<br />
The following table details the Group’s foreign currency sensitivity as at 31 December 2016 and 2015:<br />
31 December 2016<br />
Profit / (loss)<br />
Valuation<br />
of foreign<br />
currency<br />
Valuation<br />
of foreign<br />
currency<br />
31 December 2015<br />
Profit / (loss)<br />
Valuation<br />
of foreign<br />
currency<br />
Valuation<br />
of foreign<br />
currency<br />
In the case of TL gaining 10% value<br />
against US Dollar<br />
1- TL net asset / (liability) 164 (164) 220 (220)<br />
2- Portion hedged against TL risk (-) - - - -<br />
3- TL net effect (1+2) 164 (164) 220 (220)<br />
In the case of Euro gaining 10% value<br />
against US Dollar<br />
4- Euro net asset / (liability) 20,691 (20,691) 25,427 (25,427)<br />
5- Portion hedged against Euro risk (-) 258 (258) 5,694 (5,694)<br />
6- Euro net effect (4+5) 20,949 (20,949) 31,121 (31,121)<br />
In the case of other foreign currencies<br />
gaining 10% value against US Dollar<br />
7- Other foreign currency net asset / (liability) 21,540 (21,540) 25,840 (25,840)<br />
8- Portion hedged against<br />
other foreign currency risk (-)<br />
- - - -<br />
9- Other foreign currency net effect (7+8) 21,540 (21,540) 25,840 (25,840)<br />
Total (3+6+9) 42,653 (42,653) 57,181 (57,181)<br />
Credit risk<br />
Credit risk is the risk that one party to a financial instrument will fail to discharge an obligation and cause the other<br />
party to incur a financial loss. The Group attempts to control credit risk by monitoring credit exposures, limiting<br />
transactions with specific counterparties, and continually assessing the creditworthiness of counterparties.<br />
Concentrations of credit risk arise when a number of counterparties are engaged in similar business activities or<br />
activities in the same geographic region, or have similar economic features that would cause their ability to meet<br />
contractual obligations to be similarly affected by changes in economic, political or other conditions. The Group<br />
seeks to manage its credit risk exposure through diversification of sales activities to avoid undue concentrations<br />
of risks with individuals or groups of customers in specific locations or businesses. It also obtains security when<br />
appropriate. It is the Group’s policy to enter into financial instruments with a diversity of creditworthy<br />
counterparties. Therefore, the Group does not expect to incur material credit losses on its risk management or other<br />
financial instruments.<br />
73<br />
74<br />
234 | ENKA Annual Report 2016<br />
ENKA Annual Report 2016 | 235