

chapter - Atmospheric and Oceanic Science
chapter - Atmospheric and Oceanic Science
chapter - Atmospheric and Oceanic Science

You also want an ePaper? Increase the reach of your titles
YUMPU automatically turns print PDFs into web optimized ePapers that Google loves.
8.3.3. Energy<br />
a. Hydroelectric dependence<br />
The main services <strong>and</strong> problems of water resource<br />
Worldwide, the big hydroelectric dams provide 10% of the total generation of<br />
electricity in 113 countries. They contribute to more than 20% of this generation in<br />
91 countries <strong>and</strong> in more than 50% in 63 countries. Almost all the above mentioned<br />
are developing countries or from the ex-Soviet Union.<br />
Many of the countries dependent on the hydroelectricity are already experiencing<br />
energetic shortage in periods of drought. The countries that have suffered<br />
blackouts <strong>and</strong> energy rationing due to the droughts in the recent years, include<br />
Albania, Argentina, Brazil, Chile, Colombia, Ecuador, Ghana, Guatemala, India,<br />
Kenya, Peru, Sri Lanka, Tadzhikistan, Vietnam, Zambia <strong>and</strong> Zimbabwe. Regions of<br />
Norway <strong>and</strong> USA have also experienced problems in the supply of energy due to<br />
low levels of water in the dams.<br />
In several of these countries that already highly depend on hydroelectricity, the<br />
construction of new hydroelectric facilities is being planned, as in the case of the<br />
countries of the La Plata basin. There is a need to satisfy the increasing dem<strong>and</strong> <strong>and</strong><br />
in addition, the relation between installed power <strong>and</strong> maximum dem<strong>and</strong> is currently<br />
relatively small for a situation where most of the stock is hydraulic <strong>and</strong> therefore<br />
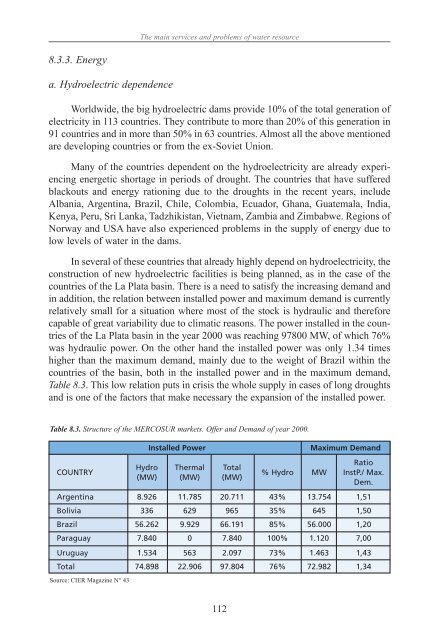
capable of great variability due to climatic reasons. The power installed in the countries<br />
of the La Plata basin in the year 2000 was reaching 97800 MW, of which 76%<br />
was hydraulic power. On the other h<strong>and</strong> the installed power was only 1.34 times<br />
higher than the maximum dem<strong>and</strong>, mainly due to the weight of Brazil within the<br />
countries of the basin, both in the installed power <strong>and</strong> in the maximum dem<strong>and</strong>,<br />
Table 8.3. This low relation puts in crisis the whole supply in cases of long droughts<br />
<strong>and</strong> is one of the factors that make necessary the expansion of the installed power.<br />
Table 8.3. Structure of the MERCOSUR markets. Offer <strong>and</strong> Dem<strong>and</strong> of year 2000.<br />
COUNTRY<br />
Installed Power Maximum Dem<strong>and</strong><br />
Hydro Thermal Total<br />
(MW) (MW) (MW)<br />
112<br />
% Hydro MW<br />
Ratio<br />
InstP./ Max.<br />
Dem.<br />
Argentina 8.926 11.785 20.711 43% 13.754 1,51<br />
Bolivia 336 629 965 35% 645 1,50<br />
Brazil 56.262 9.929 66.191 85% 56.000 1,20<br />
Paraguay 7.840 0 7.840 100% 1.120 7,00<br />
Uruguay 1.534 563 2.097 73% 1.463 1,43<br />
Total<br />
Source: CIER Magazine N° 43<br />
74.898 22.906 97.804 76% 72.982 1,34


