

chapter - Atmospheric and Oceanic Science
chapter - Atmospheric and Oceanic Science
chapter - Atmospheric and Oceanic Science

Create successful ePaper yourself
Turn your PDF publications into a flip-book with our unique Google optimized e-Paper software.
In the case of the Paraná River the relative increase of mean minimum <strong>and</strong><br />
maximum flows is similar to that of the mean flow, indicating an increase in the<br />
amplitude (that is, greater variability), while for the Uruguay River such amplitude<br />
has remained practically invariable (Jaime <strong>and</strong> Menéndez 2002).<br />
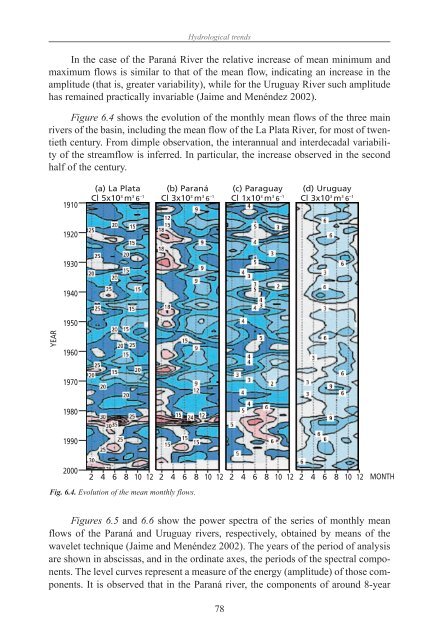
Figure 6.4 shows the evolution of the monthly mean flows of the three main<br />
rivers of the basin, including the mean flow of the La Plata River, for most of twentieth<br />
century. From dimple observation, the interannual <strong>and</strong> interdecadal variability<br />
of the streamflow is inferred. In particular, the increase observed in the second<br />
half of the century.<br />
YEAR<br />
1910<br />
1920<br />
1930<br />
1940<br />
1950<br />
1960<br />
1970<br />
1980<br />
1990<br />
2000<br />
(a) La Plata<br />
Cl 5x10 3 m 3 6 –1<br />
(b) Paraná<br />
Cl 3x10 3 m 3 6 –1<br />
Fig. 6.4. Evolution of the mean monthly flows.<br />
Hydrological trends<br />
2 4 6 8 10 12 2 4 6 8 10 12 2 4 6 8 10 12 2 4 6 8 10 12 MONTH<br />
Figures 6.5 <strong>and</strong> 6.6 show the power spectra of the series of monthly mean<br />
flows of the Paraná <strong>and</strong> Uruguay rivers, respectively, obtained by means of the<br />
wavelet technique (Jaime <strong>and</strong> Menéndez 2002). The years of the period of analysis<br />
are shown in abscissas, <strong>and</strong> in the ordinate axes, the periods of the spectral components.<br />
The level curves represent a measure of the energy (amplitude) of those components.<br />
It is observed that in the Paraná river, the components of around 8-year<br />
78<br />
(c) Paraguay<br />
Cl 1x10 3 m 3 6 –1<br />
(d) Uruguay<br />
Cl 3x10 3 m 3 6 –1


